
6 stories
Data Visualization
-

Comparing Web Mapping Libraries for Interactive Projects
-
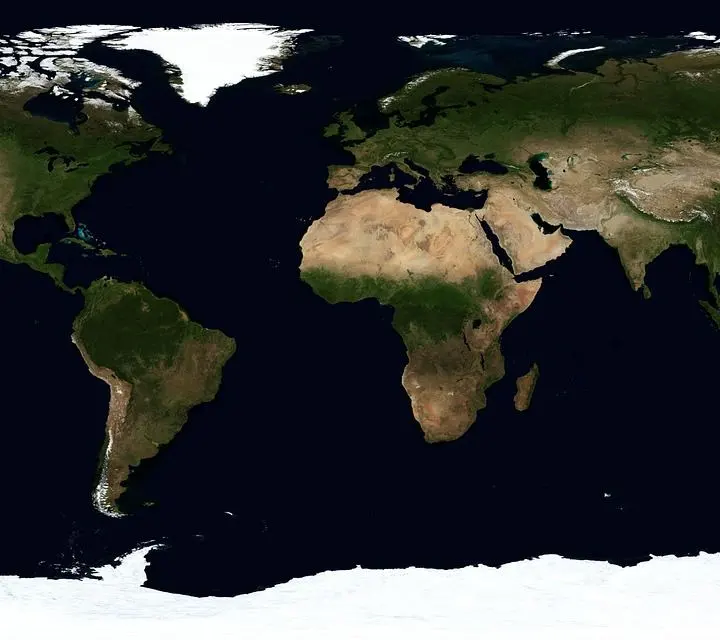
Choosing a Map Type for Counts, Rates, Patterns and Movement
-
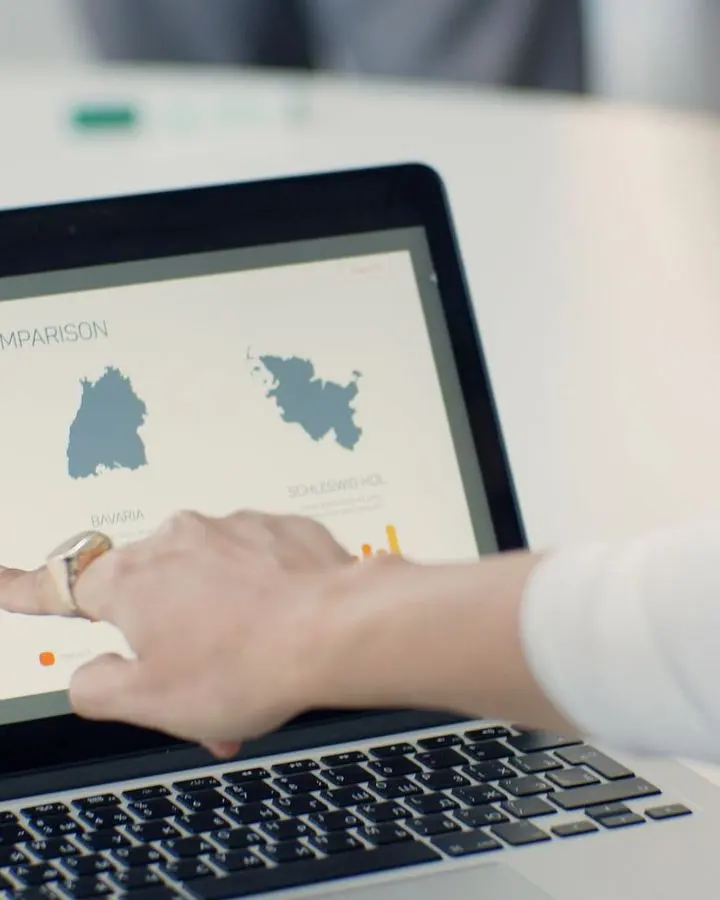
How Map Design Distorts Data and How to Spot the Problems
-
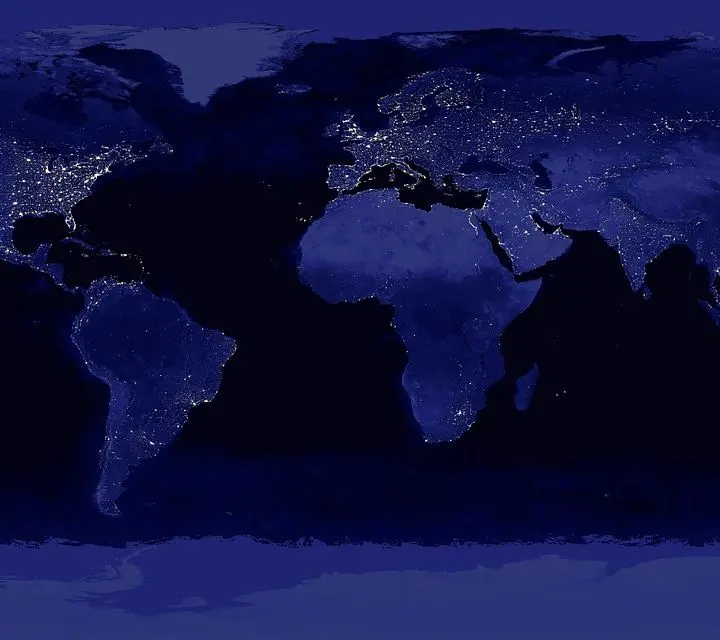
Build a Choropleth Map with Appropriate Rates and Class Breaks
-
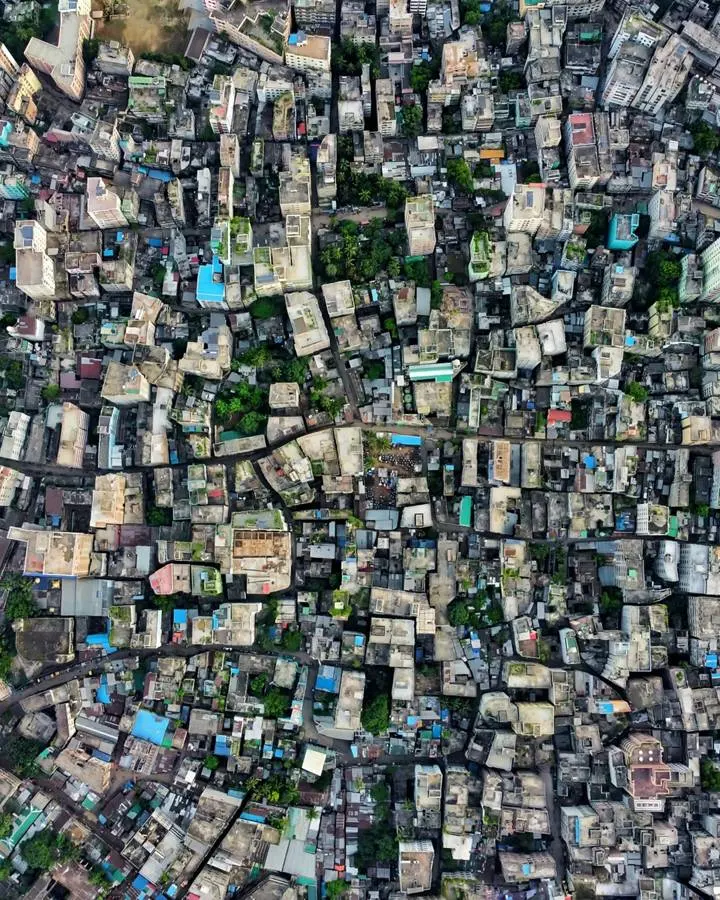
Heat Maps and Choropleths: Density and Regional Values Compared
-

Designing Readable Maps with Clear Symbols, Labels and Color