Wondering if a green map really means healthy plants? NDVI turns red and near-infrared light into a greenness score, but soil, water, clouds and seasons can skew it.
This page belongs to the wider topic of satellite imagery, which covers how the sensors behind these maps collect their data.
| Item | Value |
|---|---|
| NDVI formula | (NIR – Red)/(NIR + Red) |
| General NDVI range | -1 to 1 |
| Barren rock, sand or snow | 0.1 and below |
| Shrub and grassland | 0.2 to 0.3 |
| Temperate and tropical rainforest | 0.6 to 0.8 |
| Sentinel-2 pixel size | 10 meters |
These figures come from NASA’s Sentinel-2 NDVI data gallery and NASA Earth Observatory’s vegetation article. They can change, so check the sources before you rely on them.
How NDVI is calculated
The index is a simple ratio of two kinds of reflected light. NASA’s Disasters Portal gives the formula as (NIR – Red)/(NIR + Red), where NIR is near-infrared reflectance and Red is visible red reflectance (NASA Disasters Portal).
Which sensor bands feed the formula depends on the satellite. For Sentinel-2, the same page says NDVI is commonly calculated from MSI Band 8 for near-infrared and Band 4 for red. Because the result is a ratio, it has no unit: it is only a relative greenness score for each pixel.
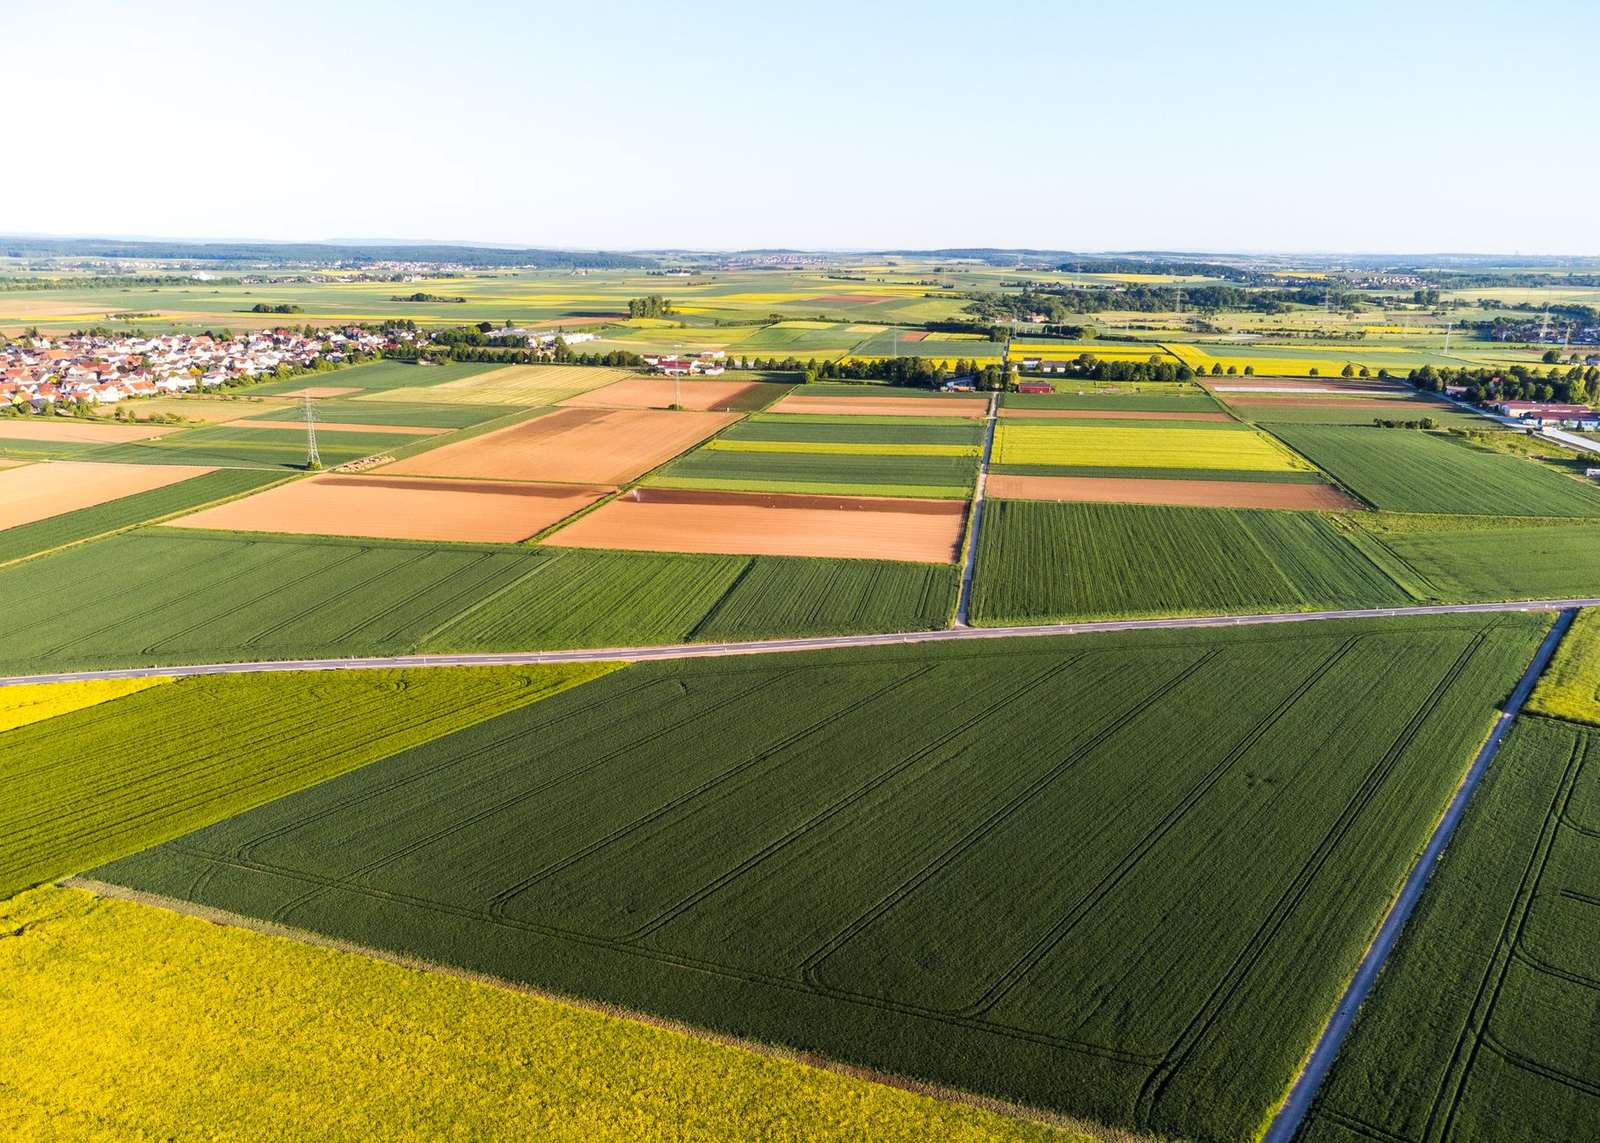
Every pixel in a map like the one above gets its own score, and the colour ramp is then chosen by whoever makes the map. The same number can therefore look alarming or calm depending on the palette, so read the legend first.
What NDVI values usually mean
NASA describes the scale as running from -1 to 1. Higher positive values are associated with dense, healthy green vegetation, while lower or negative values are associated with sparse vegetation, bare surfaces, water, snow, clouds or other non-vegetated areas (NASA Disasters Portal).
NASA Earth Observatory gives rough landmarks along that scale (NASA Earth Observatory):
- Barren rock, sand or snow sit at 0.1 and below.
- Shrub and grassland fall around 0.2 to 0.3.
- Temperate and tropical rainforests reach about 0.6 to 0.8.
Treat these as landmarks rather than thresholds. A grassland that scores near the low end of the shrub range is not necessarily unhealthy; it may simply be grassland.
Where the data comes from
NDVI is the most common vegetation measurement in satellite maps, and several long-running programmes produce it. Three sources show up most often:
- AVHRR: NOAA’s Advanced Very High Resolution Radiometer has been used by scientists to collect images of the planet’s surface (NASA Earth Observatory).
- MODIS: NASA’s vegetation index products are produced on 16-day intervals and at multiple spatial resolutions (NASA LAADS DAAC).
- Sentinel-2: the MultiSpectral Instrument gives NDVI at 10 meters (NASA Disasters Portal).
The MODIS NDVI product was designed to provide continuity with NOAA’s AVHRR NDVI time series record for historical and climate applications. Since the Terra and Aqua sensors are identical, each composite is generated eight days apart so that both records can be combined (NASA LAADS DAAC).
Where NDVI can mislead
NASA advises that NDVI should be interpreted together with other imagery and environmental information, because vegetation type, seasonality, atmospheric conditions, soil background and surface moisture can influence observed values (NASA Disasters Portal). Each of those factors causes a different kind of error:
- Vegetation type: a healthy shrubland and a healthy rainforest sit in very different ranges, so one number cannot be compared across cover types.
- Seasonality: a low score in the dormant part of the year may be completely normal for that place.
- Atmosphere: haze and clouds change the light that reaches the sensor, and clouds themselves are listed among the low-scoring surfaces.
- Soil background: where plants are sparse, bare ground contributes to the signal and can blur the picture.
- Surface moisture: wet and dry surfaces can shift the value even when the plants have not changed.
A related index exists to address some of this. The enhanced vegetation index (EVI) is described as minimizing canopy-soil variations and improving sensitivity over dense vegetation conditions (NASA LAADS DAAC). That hints at where plain NDVI is weaker: bare-soil backgrounds and very dense canopies.
There is also a data-quality caveat. NASA’s terms say such products can be experimental- or research-grade and may not be appropriate for operational use (NASA Disasters Portal).
How to read an NDVI map more safely
A few habits cut most of the risk of misreading a greenness map:
- Check the sensor and pixel size first, since a 10 meters pixel and a coarse composite describe very different amounts of ground.
- Compare like with like: the same season, the same land cover and a similar atmospheric situation.
- Look at the colour image beside the index. Understanding satellite imagery band combinations helps you confirm what the pixels actually show.
- Watch the trend rather than a single date. The method behind satellite image change detection is a good way to separate real loss or recovery from ordinary seasonal swings.
- Confirm important findings with other data or a ground check before acting.
NASA lists vegetation loss, stress and recovery after wildfire, flooding, severe weather and drought or heat among the uses of before-and-after NDVI (NASA Disasters Portal). Used that way, the index is a screening tool that points you to places worth a closer look.
Frequently asked questions
What is a good NDVI value?
Show answer
There is no single good number. Dense, healthy green cover sits toward the upper end of the scale and sparse cover sits lower, so a good value depends on whether the land is forest, grassland or desert shrub (NASA Disasters Portal).
Can NDVI be negative?
Show answer
Yes. Water, snow, clouds and bare ground all pull the score down, and the full scale runs from -1 to 1 (NASA Disasters Portal).
How is EVI different from NDVI?
Show answer
EVI also uses the blue waveband, and NASA says it dampens canopy-soil variation and stays more sensitive over dense vegetation. NDVI, by contrast, keeps a link to the older AVHRR record (NASA LAADS DAAC).
Why do MODIS vegetation maps come as composites?
Show answer
Each composite filters out poor-quality pixels first. Then, from the two highest NDVI values, the pixel nearest to straight-down viewing is chosen for a 16-day period (NASA LAADS DAAC).