Satellite imagery is Earth observed from orbit, and the right type depends on your question. If you need fine detail, cloud-proof views or crop health, match the sensor to the task first, then pick the data.
| Item | Value |
|---|---|
| Optical imager horizontal spatial resolution | 1-300 m |
| Optical imager swath width | tens to hundreds of km |
| Sentinel-2 imagery used for vegetation indices | 10 m |
| Landsat-8/9 imagery used for vegetation indices | 30 m |
| Pre-calculated NDVI dataset from the Copernicus Land Monitoring Service | 300 m |
The figures come from the ESA overview of optical missions and the ESA Knowledge Hub page on vegetation indices. They can change, so check the source before you rely on them.
How satellite imagery is captured
Remote sensing is the process of acquiring information about the landscape from ground platforms, aircraft, or satellites to assess surface characteristics such as topography, vegetation, and soil properties, as the USGS review of mine-land monitoring puts it. Satellite imagery is that same idea captured from orbit. Each pixel in an image records what the sensor measured for one patch of ground.
Most imagery you will meet comes from a few sensor families:
- Optical imagers and multispectral radiometers, which provide images of Earth’s surface and atmosphere.
- Synthetic aperture radar (SAR), which supplies imagery that does not depend on daylight or clear skies.
- Hyperspectral and LiDAR instruments, which add finer spectral detail and structural information.
The ESA Knowledge Hub notes that hyperspectral imaging and LiDAR can complement vegetation assessments further by capturing spectral signatures and structural attributes in more detail, according to the ESA vegetation indices page. Most everyday mapping work still starts with optical or radar scenes.
Where the scenes come from matters as much as how they are taken, so read the guide to free satellite imagery before you commit to a paid source.
What optical imagery shows and where it falls short
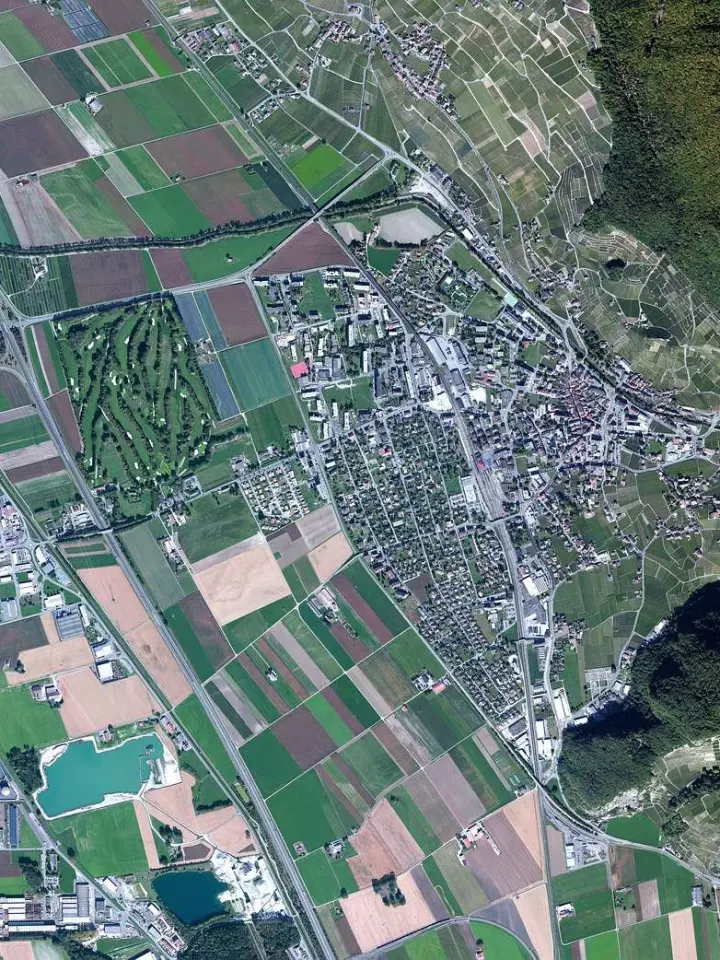
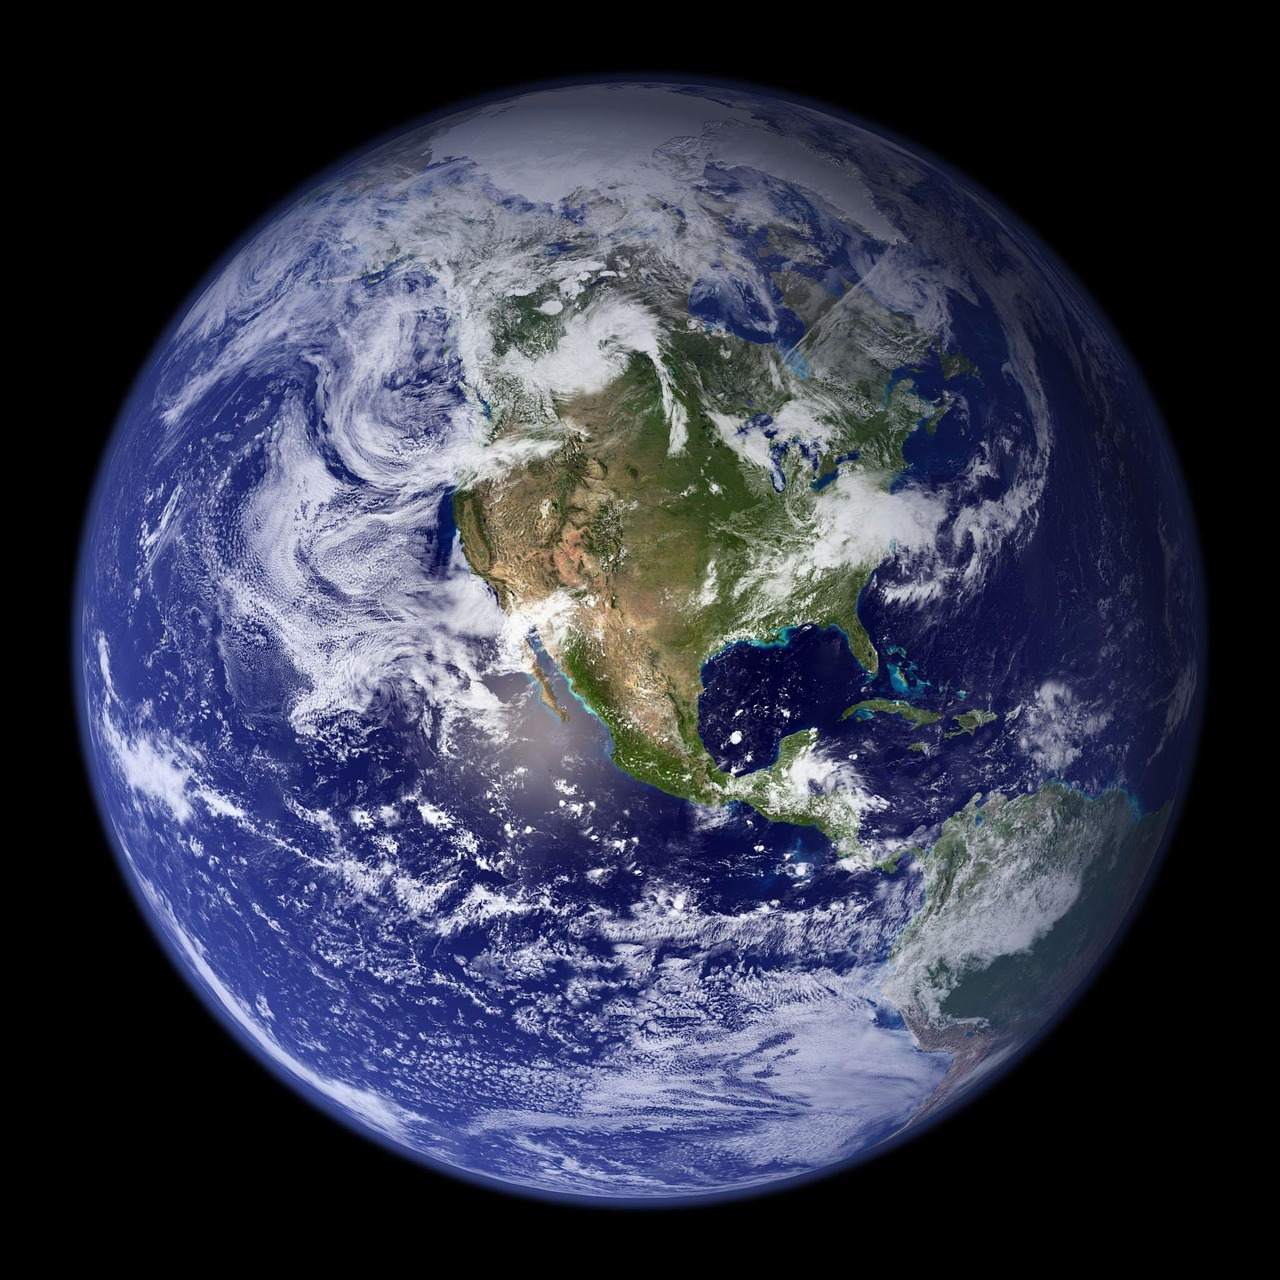
Optical imagers are among the most common instruments used for Earth observation, according to the ESA overview of optical missions. They are generally nadir-viewing, with a horizontal spatial resolution spanning 1-300 m and swath widths in the order of tens to hundreds of km. That wide spread explains why one mission can suit a farm and another a whole region.
A separate explainer on satellite image resolution covers pixel size and swath in more depth.
ESA lists many application areas for optical data, including:
- agriculture
- land-cover mapping
- damage assessment associated with natural hazards
- urban planning
The main weakness is that optical instruments are limited to cloud-free conditions and daytime operation, as the same ESA page states. If your area is often cloudy, a single clear scene may take a long time to appear. That is the moment to look at radar.
For vegetation work, the ESA Knowledge Hub says users can generate their own indices from Sentinel-2 imagery at 10 m or Landsat-8/9 imagery at 30 m, as described on its vegetation indices page. The comparison of Sentinel vs Landsat helps you decide which family fits your project.
Radar imagery for clouds, night and forests
Synthetic aperture radar fills the gaps optical sensors leave. The ESA Knowledge Hub explains that SAR sensors, such as those on the Sentinel-1 constellation, are more commonly used to complement optical information, and can stand in for optical sensors when frequent cloud cover limits them, per its vegetation indices page.
The STEP list of supported satellite products describes EOS-04 as an ISRO C-band radar satellite providing all-weather, day-and-night imagery for agriculture, forestry, soil moisture and flood mapping. A fuller comparison sits in SAR vs optical imagery.
The same STEP product list gives a feel for how varied radar missions are:
- ALOS-4 is a JAXA L-band SAR mission carrying the PALSAR-3 sensor, with a ground resolution of 3 m to 25 m depending on mode.
- Biomass carries a P-band radar designed to deliver information about the state of forests and the role they play in the carbon cycle.
- Cosmo-Skymed is a dual use constellation of 4 SAR satellites developed by ASI.
- Capella is an American company providing on-demand imagery through a constellation of small satellites.
Radar data often arrives in specialised forms. The STEP page notes that Capella products can be ordered in GeoTiff formats, and that for InSAR processing SLC products should be ordered. Check the product type before you buy or download, because the wrong one can limit what you can do with the scene.
Vegetation indices built from satellite imagery
Remote sensing-derived vegetation indices provide key information on vegetation conditions and land cover, from local to global scales, according to the ESA Knowledge Hub. They are widely used to estimate vegetation metrics such as chlorophyll concentration, water content, leaf area, and biomass.
Optical satellites such as Sentinel-2 feed several well-known indices, as the same page lists:
- Normalized Difference Vegetation Index (NDVI)
- Enhanced Vegetation Index (EVI)
- Soil-Adjusted Vegetation Index (SAVI)
- Green Chlorophyll Index (GCI)
The dedicated guide to NDVI walks through the most familiar one. Which bands you display or combine is a separate choice, covered in satellite imagery band combinations.
You do not always need to calculate an index yourself. The ESA Knowledge Hub points to pre-calculated datasets, such as an NDVI product at 300 m from the Copernicus Land Monitoring Service, on its vegetation indices page. Coarse products suit regional questions, while 10 m or 30 m imagery suits field-scale work.
Radar can contribute too: the Radar Vegetation Index is one example of a vegetation indicator derived from SAR, which describes vegetation structure rather than colour.
Practical uses across land, hazards and mining
Satellite data answers different questions depending on the sensor and index you choose. The sources behind this guide describe these uses:
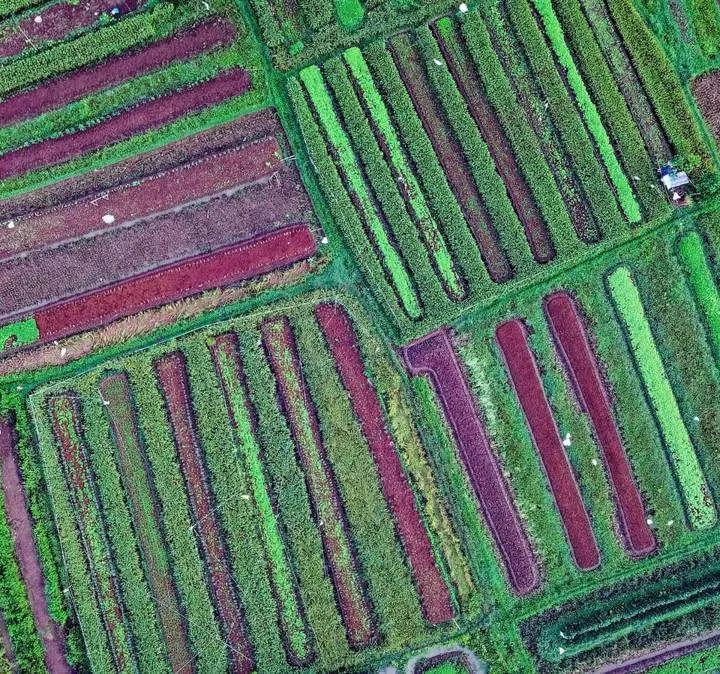
- Crop management: vegetation indices are often used to monitor indications of crop water stress or nutrient deficiencies and to optimise yield and resource allocation.
- Drought and food security: optical data on global vegetation and its seasonal variation is important for identifying areas of drought and early warning of food shortages.
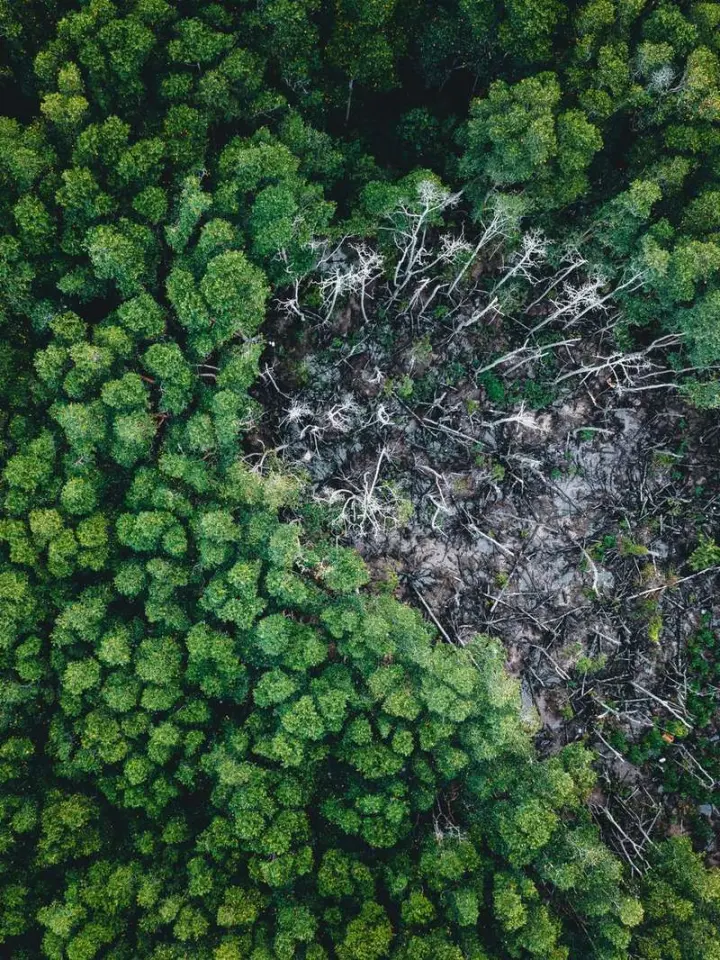
- Forestry: indices help identify condition changes related to degradation, deforestation and restoration.
- Pest monitoring: satellite data supports locust monitoring.
- Mine land recovery: imagery helps identify mining sites and assess their environmental effects.
On pests, the ESA Knowledge Hub says a small swarm, comprising up to 80 million locusts, can cause widespread damage to crops and vegetation, which is why locust monitoring appears among its agriculture use cases. See the ESA vegetation indices page for the full list.
The USGS report points out that mine lands occur in every State of the United States and present a range of environmental hazards and safety risks. It adds that remote sensing is most effective for recovery when targets are clearly defined and quantifiable from data collected before mining activity, as set out in the USGS circular on mine lands.
Many of these tasks come down to comparing scenes over time, which is the subject of satellite image change detection. Once you have results, geospatial data visualization turns them into maps and charts, and geospatial terrain visualization adds relief for context.
How do you choose and read the right imagery?
A short, repeatable routine keeps you from downloading the wrong data. Work through these steps in order:
- Write down the question: a crop, a forest, a flood, a mine site or a city block.
- Decide whether clouds or darkness will block an optical scene; if so, plan for radar.
- Match pixel size and swath to the size of the area you study.
- Choose an index or band display that reveals the feature you care about.
- Define a baseline or target before you begin, so later scenes have something to be measured against.
Reading the result is its own skill. The walkthrough on how to interpret satellite images shows how to move from a coloured grid to a defensible conclusion.
Frequently asked questions
Is satellite imagery the same as an aerial photograph?
Show answer
No. Both belong to remote sensing, but aerial photographs are taken from aircraft, while satellite imagery is gathered from orbit by sensors that may record far more than visible colour.
Can satellite imagery see through clouds?
Show answer
Optical sensors cannot. Radar sensors are the usual alternative where frequent cloud cover restricts optical data, and some radar missions are described as all-weather and day-and-night.
Which type of imagery suits crop monitoring?
Show answer
Multispectral optical data combined with a vegetation index is the common choice for tracking crop condition. Radar can add information about vegetation structure when skies are persistently cloudy.
Why do resolution figures differ between sources?
Show answer
Missions, instruments and product levels differ, so a quoted figure usually describes one mode or one product. Always read the product description before you plan an analysis around a number.