Geospatial terrain visualization turns raw elevation data into maps you can read at a glance. If you’re unsure where to start, begin with a DEM, add a hillshade, then layer thematic data on top and check your settings.
| Item | Value |
|---|---|
| Default sun azimuth, traditional hillshade | 315 degrees (from the northwest) |
| Default sun altitude, traditional hillshade | 45 degrees above the horizon |
| Possible altitude range | 0 to 90 degrees |
| Light sources in a multidirectional hillshade | six directions |
| Default pixel size power, adjusted scaling | 0.664 |
| Default pixel size factor, adjusted scaling | 0.024 |
These figures come from the ArcGIS Pro hillshade function documentation, which describes one software package’s defaults. Documentation changes between releases, so check the source before you rely on them.
What terrain visualization shows
Terrain visualization is the craft of drawing elevation so that ridges, valleys and slopes become readable. Most workflows start from a gridded elevation surface rather than from contour lines or photographs. Everything described here sits inside a GIS, and a primer on what is GIS helps if the vocabulary is new to you.
An elevation surface is a grid of cells, which makes it a raster. The trade-offs against point and line geometry are covered in the guide to raster vs vector data.
The same surface can be drawn in several ways, and each one answers a different question:
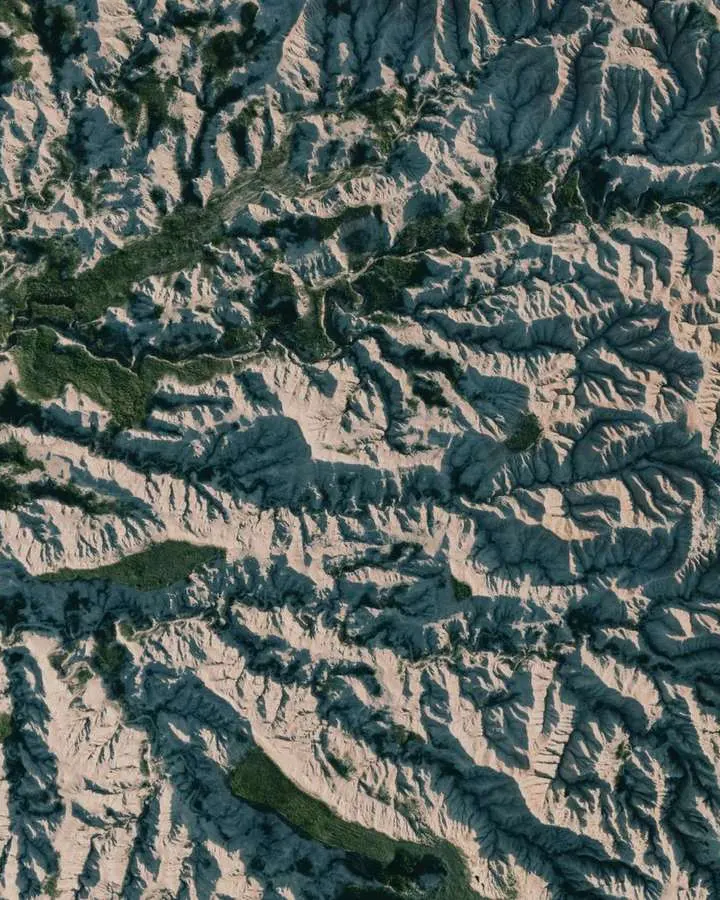
- Hillshade: a shaded-relief picture that makes the shape of the land obvious.
- Hypsometric tint: a colour ramp that separates low ground from high ground.
- Contour lines: vector lines of equal elevation, useful when readers need to estimate heights.
- Slope and aspect maps: derived rasters that describe steepness and the direction a slope faces.
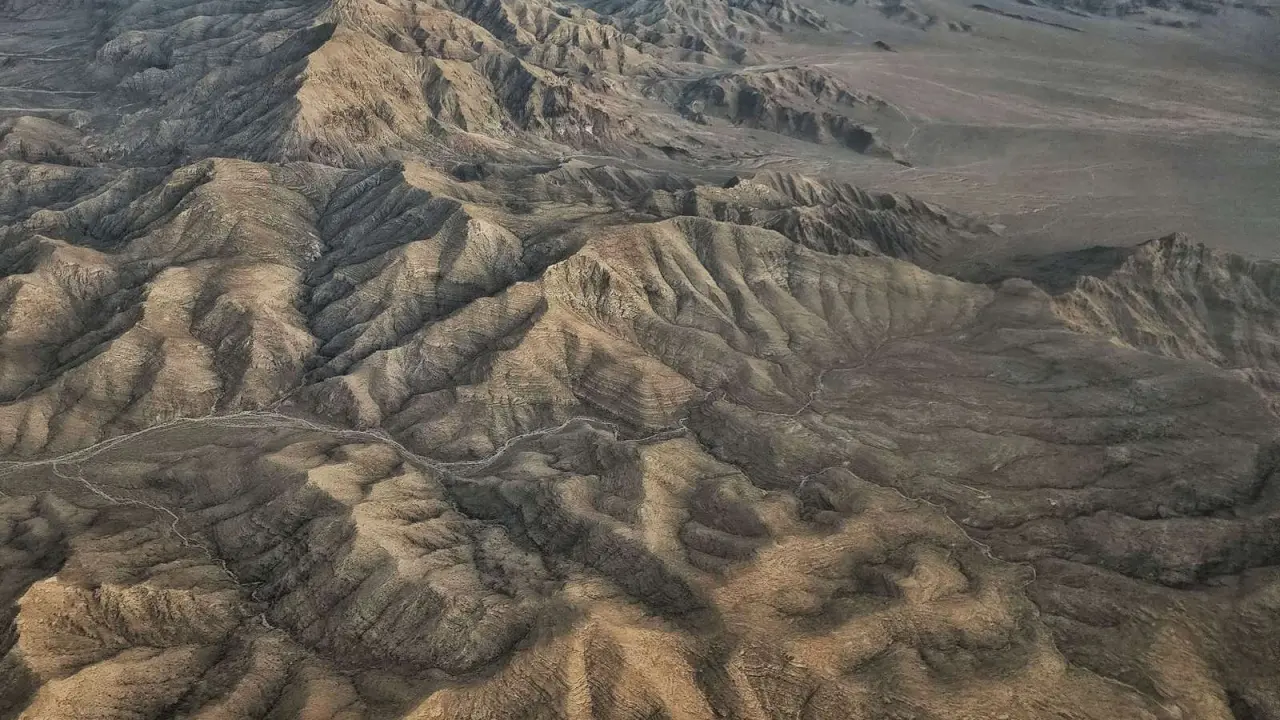
- Perspective views: oblique renderings that trade measurement for intuition.
Your choice of starting surface matters as well. A model that includes tree canopy and rooftops reads very differently from a bare-earth model, and DEM vs DSM vs DTM sets out those differences.
Preparing elevation data before you style anything
Most disappointing terrain maps fail before any shading is applied. The elevation grid may be in the wrong projection, its vertical units may not match its horizontal ones, or the layers you want on top may sit in a different place. A short checklist saves hours.
- Pick an elevation dataset that suits the size of your area and the scale of the final map.
- Confirm its horizontal coordinate system and its vertical units.
- Bring every companion layer into a compatible system.
- Inspect the edges of tiles and any NoData gaps.
- Only then choose a light direction and a colour scheme.
If you are still looking for an elevation grid, the overview of free GIS data lists where open datasets usually come from. A refresher on coordinate reference systems explains why step two is never optional.
Older scanned maps or photographs need extra work before they can sit on a terrain base, and the process is described in georeferencing in GIS. When an overlay still lands in the wrong place, the troubleshooting steps for GIS layers not aligning are the quickest way to find the cause.
How do azimuth and altitude shape a hillshade?
A hillshade is a grayscale picture of the terrain surface in which the sun’s relative position is taken into account for shading, according to the ArcGIS Pro hillshade documentation. The result depends on a light source plus the slope and aspect of the elevation surface. Two settings place that light: azimuth and altitude.
Azimuth is the sun’s position along the horizon, measured clockwise from due north. In the same documentation, an azimuth of 0 degrees indicates north, 90 degrees east, 180 degrees south and 270 degrees west. The default for a traditional hillshade is 315 degrees, which puts the light in the northwest.
Altitude is the sun’s angle above the horizon and ranges from 0 to 90 degrees, as the same page explains. A value of 0 degrees places the sun on the horizon, and a value of 90 degrees places it directly overhead. The default is 45 degrees above the horizon.
In practice, this means you can steer how a map reads:
- A low altitude stretches shadows and exaggerates small bumps.
- A high altitude flattens the picture and hides subtle relief.
- Changing the azimuth reveals ridges that run parallel to the light, which are easy to miss.
Treat the result as a drawing, not a measurement. The documentation calls hillshading a qualitative method that does not give absolute elevation values, so never read heights from the grey tones.
Traditional versus multidirectional hillshade
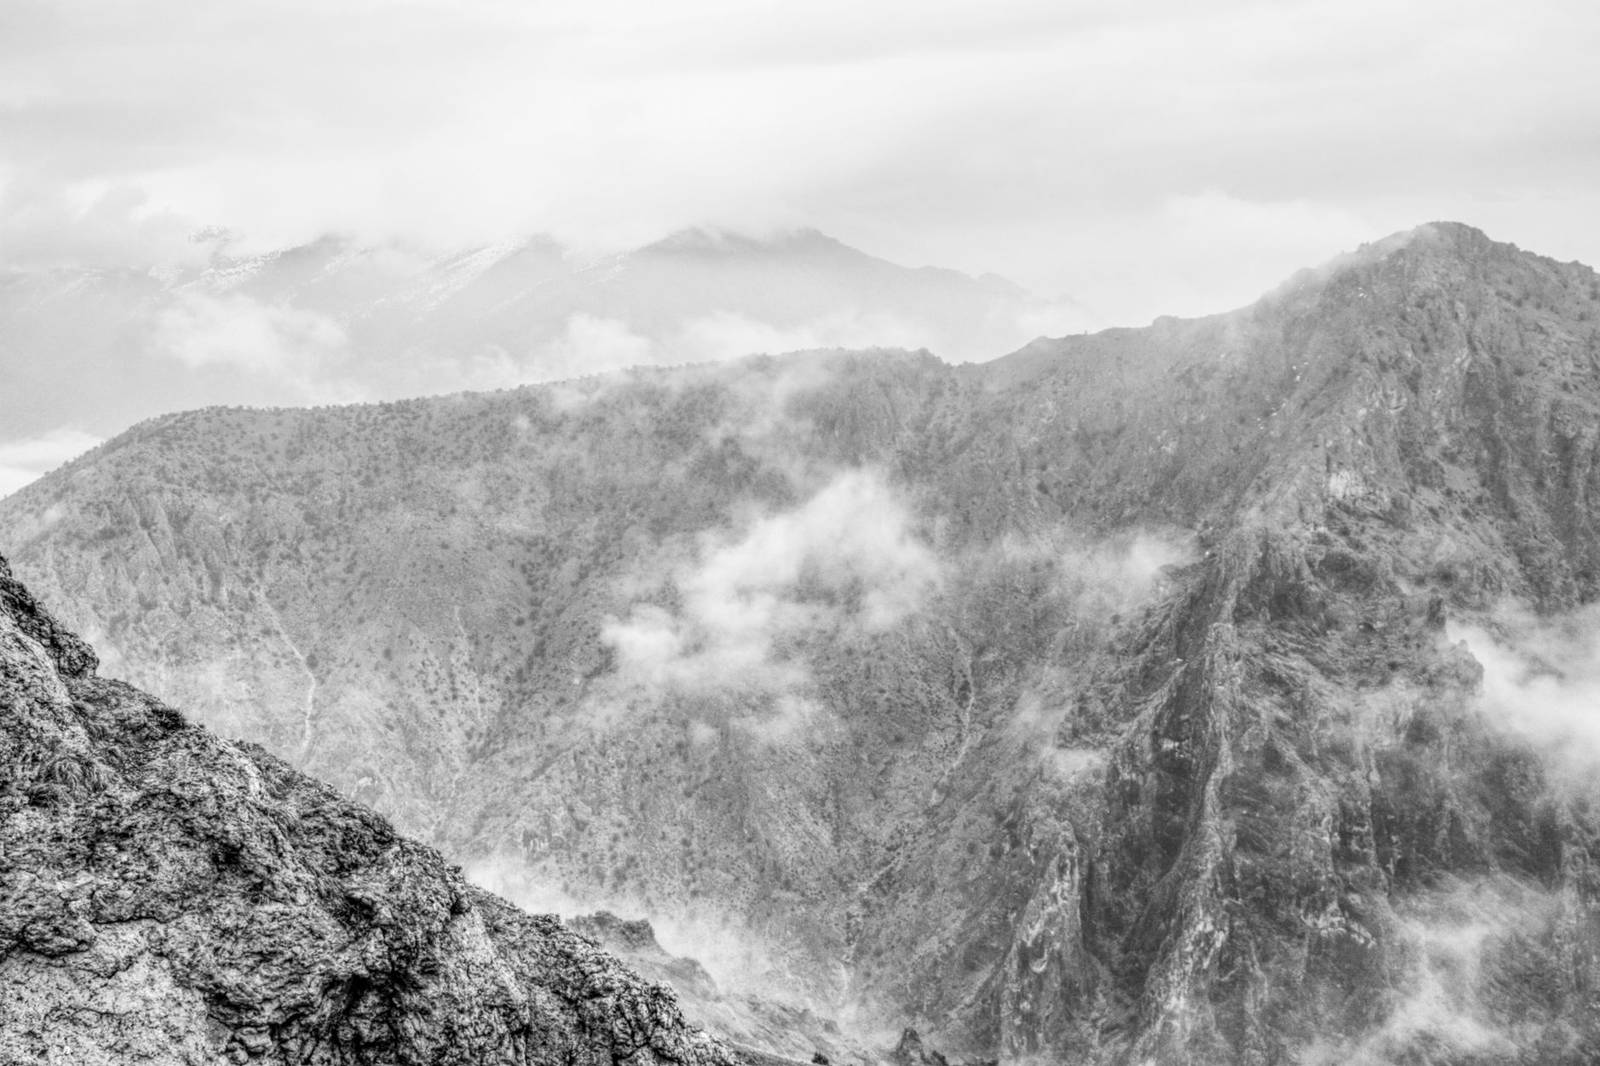
The traditional method lights the surface from a single direction that you set with azimuth and altitude. The multidirectional method combines light from several sources instead. Per the ArcGIS Pro documentation, it blends light from six different directions and improves the appearance of regions with low relief.
The documented advantage is that more detail appears in areas normally hurt by oversaturation and deep shadows. It also improves the balance between overexposed and shadowed areas of the map.
A simple way to choose between them:
- Use the traditional method when you want a deliberate, dramatic light direction for a single feature.
- Use the multidirectional method when the area is gentle, or when the shading is a quiet backdrop.
- Compare both on a small test area before you commit to a whole project.
The documentation describes the multidirectional output as suitable for a relief backdrop under topographical, soil, hydrological, land cover or other thematic maps. Its sample images use a DEM courtesy of the U.S. Geological Survey, a reminder that open elevation data feeds many published examples.
Scaling, z-factor and vertical exaggeration
The z-factor serves two purposes, per the hillshade documentation. It converts elevation units, such as meters or feet, into the horizontal coordinate units of the dataset, which may be feet, meters or degrees. It can also add vertical exaggeration for visual effect.
Scaling then decides how the z-factor behaves as you zoom. With no scaling, the documentation calls the setting ideal for a single raster dataset covering a local area. It advises against that setting for worldwide datasets or multiscale maps, because it produces terrain relief with little variation at small scales.
The adjusted option applies a nonlinear change so that relief survives zooming in and out, and it is the recommended choice for a worldwide dataset. It uses a pixel size power, with a default of 0.664, and a pixel size factor, with a default of 0.024, both listed in the same documentation page. Most users never change these numbers, but knowing they exist helps when a small-scale map looks suspiciously flat.
Tiled data brings a separate concern. An option to disable default edge pixel interpolation avoids resampling artifacts along raster edges, and the documentation says to try the alternate setting if you see tile boundary artifacts. Results can depend on your data, so test before you export a whole mosaic.
Turning a shaded map into an interpretation
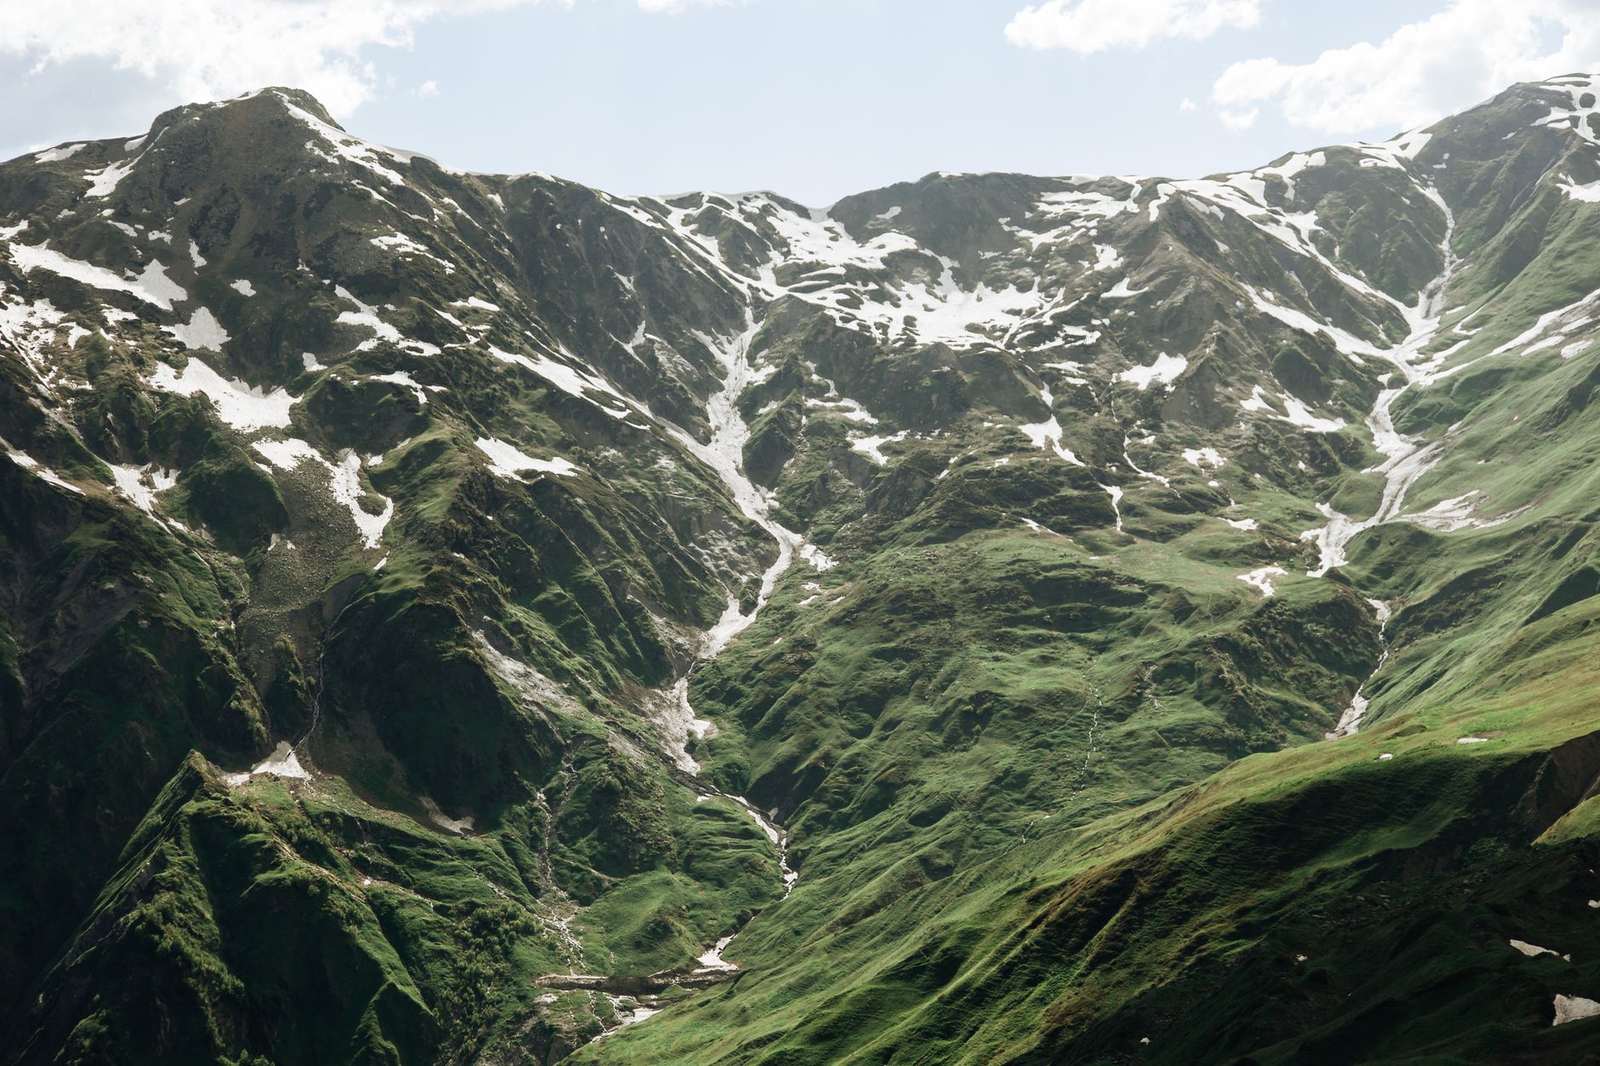
A hillshade makes land shapes obvious, but a reader still has to decide what they mean. Pair the shading with derived layers and field knowledge, and the guide to terrain analysis in GIS shows how slope, aspect and related measures turn appearance into numbers.
Terrain also works as a base for other imagery. Draping photographs or scenes from satellite imagery over a shaded surface gives an immediate sense of context. Broader design principles for thematic layers are discussed in the hub on geospatial data visualization.
Software choice affects the exact tools you click, and QGIS vs ArcGIS compares the two most common options. The principles above hold in either, even though menu names and defaults will differ.
Before you publish, run a quick review:
- State the light direction on the map, or in a note beside it.
- Check that every layer lines up with the terrain beneath it.
- Confirm the vertical exaggeration is visible to the reader if you applied any.
- Credit the elevation source and describe the surface type you used.
- Keep measurements in the data, not in the shading.
Frequently asked questions
Does a hillshade show real elevation?
Show answer
No. It is a picture of relief, so take heights from the DEM itself or from contour lines rather than from shades of grey.
Which light direction should I start with?
Show answer
Begin with the software default, light from the northwest at 315 degrees, according to the ArcGIS Pro documentation, then rotate it to see which ridges appear or vanish.
When is multidirectional shading the better pick?
Show answer
It suits quiet relief backdrops and low-relief areas, where one light direction tends to leave bright patches or heavy shadow.
Should I use adjusted scaling?
Show answer
Choose it when your map covers the whole world or spans many zoom levels. For one local raster viewed at a fixed scale, leaving scaling off is the documented fit, as the source page notes.