Not sure whether your layer should be pixels or shapes? For raster vs vector data, use raster for continuous surfaces such as elevation and imagery, and vector for distinct features such as roads and buildings.
This guide is part of the broader topic of geospatial terrain visualization, where elevation surfaces and mapped features meet.
| Item | Key fact |
|---|---|
| Raster structure | A grid of pixels in rows and columns, each holding one value |
| Best raster use | Continuous surfaces such as elevation and temperature |
| Cost of halving the pixel size | Up to four times the storage space |
| Raster value types | Integer for categories, floating point for continuous surfaces |
| Vector structure | Geometry made of vertices: points, polylines and polygons |
The figures come from the ArcGIS Pro raster documentation and the QGIS vector data guide. Software documentation changes between releases, so check the sources before you rely on them.
Two ways to describe the same place
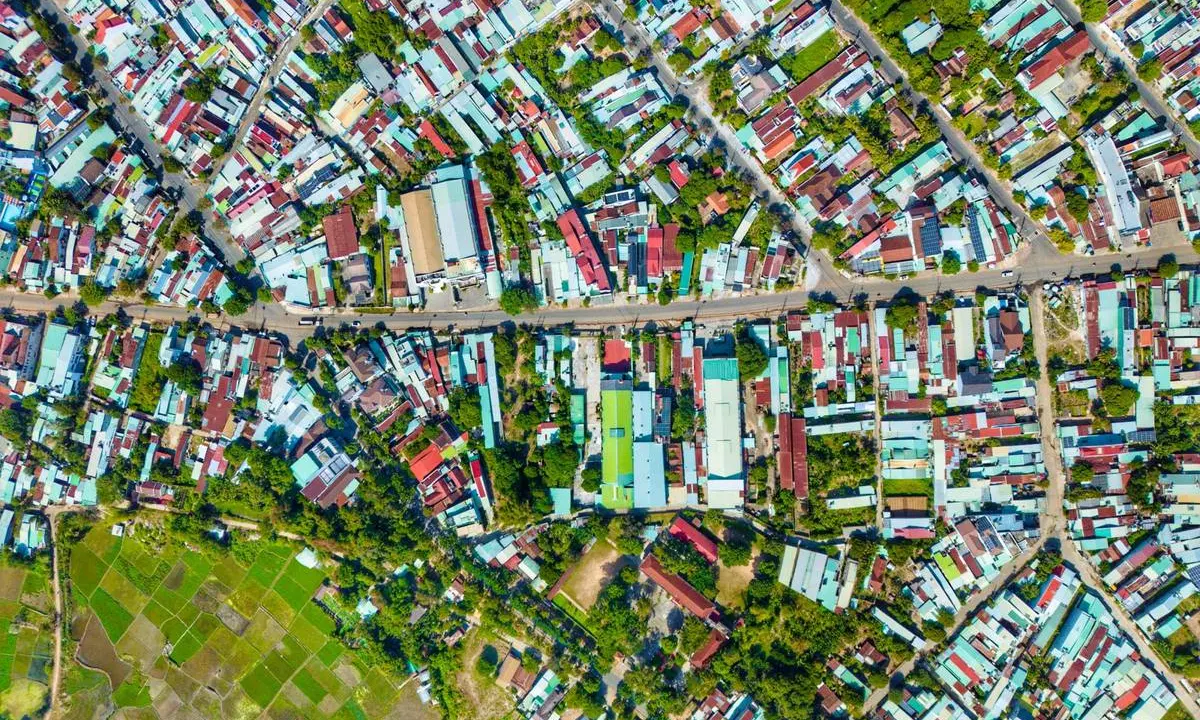
A raster stores a place as a grid. Each pixel (or cell) sits in a row and column and holds one value, such as reflectance or temperature, according to the ArcGIS Pro documentation. Aircraft, drones, satellites and scanned maps all produce rasters.
Vector data stores a place as shapes. In the QGIS guide, a feature’s geometry is made up of one or more interconnected vertices, and a point is a single vertex. A polyline has two or more vertices, and a polygon needs four or more, with the last one matching the first.
Vector features also carry attributes, which are text or numbers that describe each feature, as the same QGIS guide explains. A tree point might record its species, and a road line might record its surface.
A quick contrast helps:
- Raster: a grid of cells, suited to continuous phenomena such as elevation, temperature and aerial imagery.
- Vector: points, lines and polygons, suited to discrete things such as roads, rivers and buildings.
- Both: they need a shared position system to land in the right place on the map.
That last point is covered in coordinate reference systems, which explains how a location is described on the earth’s surface. If the wider field is new to you, the overview of what is GIS sets out the software and workflow around both data types.
When raster data is the better choice
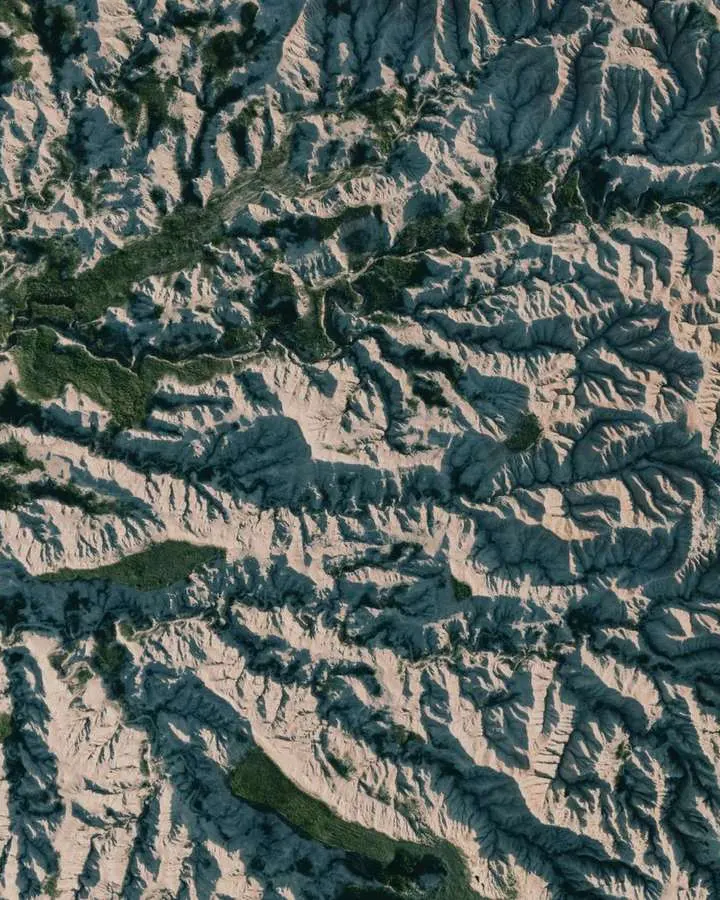
Reach for a raster when values change smoothly across space. The ArcGIS Pro documentation says rasters are well suited to data that changes continuously across a landscape. Elevation is the usual example, but rainfall, temperature, salinity, magnetic properties and material density can also define surfaces.
The QGIS raster chapter offers a grassland example. A single polygon around a meadow is easy to draw, but much of what the meadow contains is lost when the area is simplified to one shape.
In practice, rasters usually play one of three roles, as the ArcGIS Pro documentation describes:
- Basemaps: an image background beneath other feature layers.
- Surface maps: elevation, rainfall or temperature stored as a regularly spaced surface.
- Thematic maps: results such as a satellite image classified into land-cover categories.
Pixel values are typed to suit the job. Integer values are best for categorical data, while floating-point values suit continuous surfaces, again per the ArcGIS Pro documentation.
A raster needs little to be placed correctly. According to the QGIS raster chapter, georeferencing normally means a coordinate for the top left pixel, the pixel size in the X and Y directions, and any rotation.
Imagery also arrives on a schedule. For downward-looking satellites such as the Landsat series, the same location is covered again after 16 days, while drones can monitor a site daily or continuously, according to the ArcGIS Pro imagery documentation.
When vector data is the better choice
Choose vector when you are mapping things with edges and identities. The QGIS guide uses polylines for linear features such as roads, rivers and contours, and polygons for enclosed areas like dams, islands and country boundaries.
Attributes are a major strength. The same guide notes that a road line can record whether it is surfaced with gravel or tar, how many lanes it has and whether it is one way, and the GIS can then style the line from those values.
Vector data can also enforce rules. Contour lines may touch but should never cross, and a road network should be connected at intersections, according to the QGIS vector data guide. Those topology checks have no easy equivalent in a plain grid.
Vector has limits too. If a curved polyline has very large gaps between vertices, it can look angular or jagged when you zoom in, and a city drawn as a point makes more sense as a polygon at larger scales, as the QGIS guide points out.
Vector is also weak where a feature is not uniform. Attribute values apply to the whole feature, so vectors are not very good at representing things that vary inside their boundary, according to the QGIS raster chapter.
How pixel size changes cost and accuracy
Pixel size is the central trade-off for raster work. A higher resolution means a smaller pixel and greater detail, but the ArcGIS Pro pixel size documentation warns that smaller pixels also mean bigger datasets and longer processing.
The cost climbs quickly. For a given area, halving the pixel size can need as much as four times the storage space, depending on the data and storage technique, per the ArcGIS Pro raster documentation.
Match your layers to the weakest input. If a classified dataset comes from 30-meter satellite imagery, adding elevation data at a finer scale such as 10 meters may be unnecessary, according to the pixel size documentation.
Very fine data exists, though. The same page says the WorldView-3 sensor collects panchromatic images at 0.31-meter resolution. It also cautions that resampling to a smaller pixel size does not produce greater detail.
Do not confuse resolution with map scale. Zooming in changes how large the pixels look on screen, but the ground area each pixel covers stays the same, as the documentation explains.
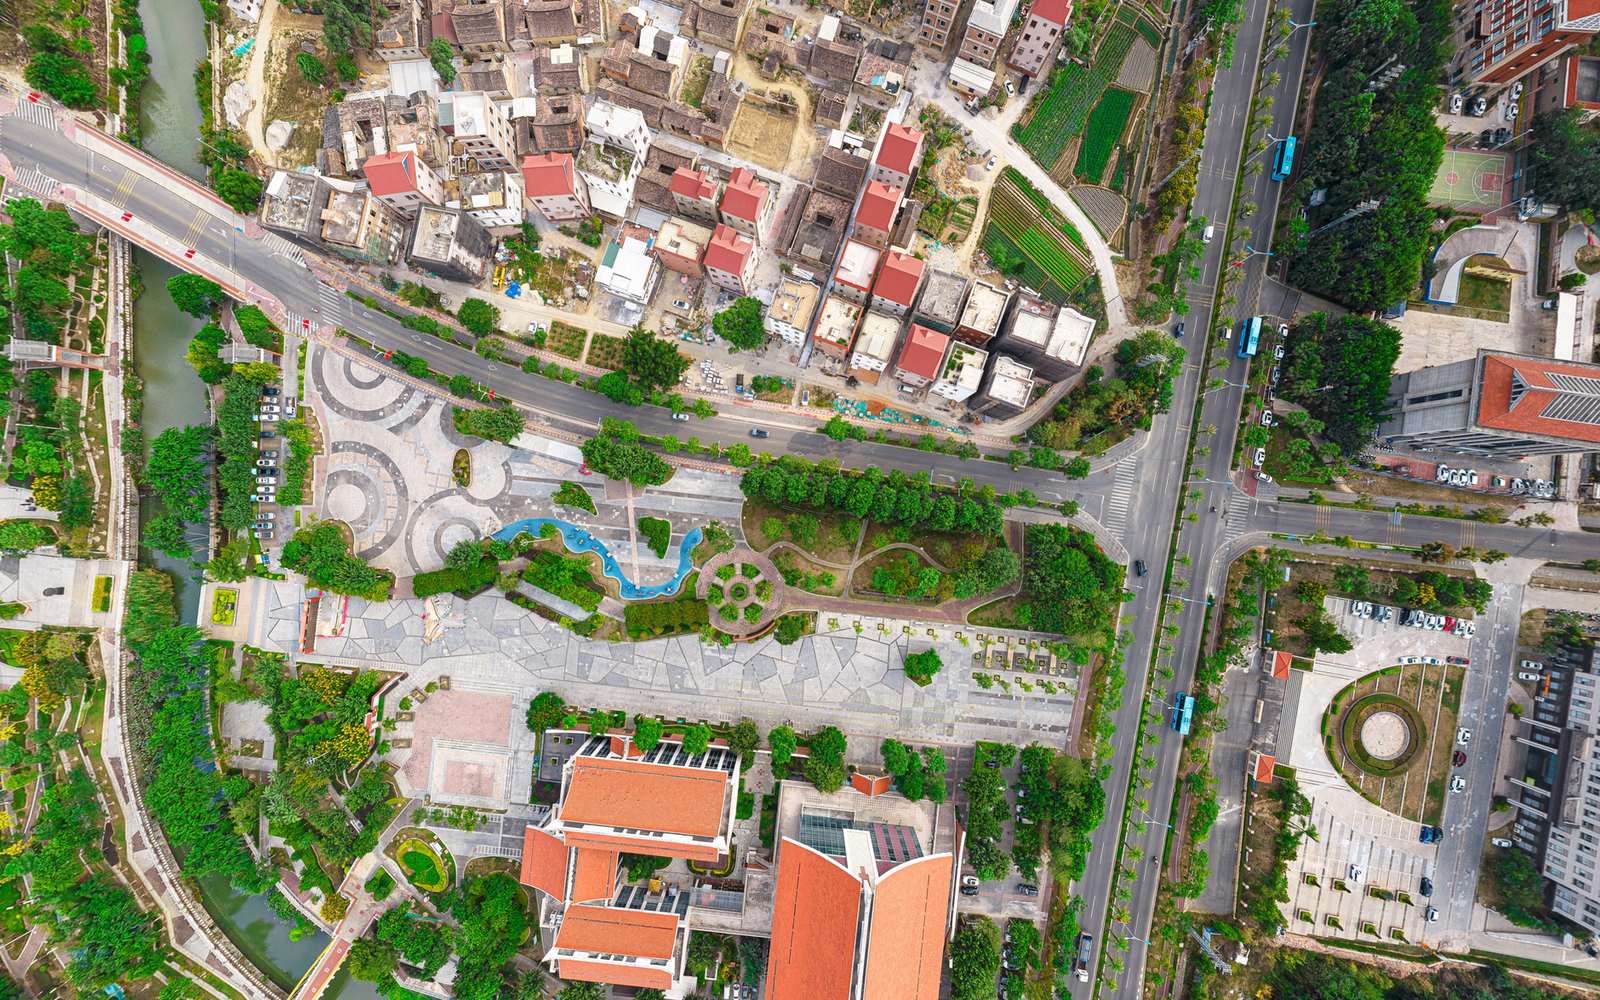
Vector data avoids this particular trade-off because a shape is stored as coordinates rather than cells. Its accuracy depends instead on how closely the vertices were captured.
Which should you pick for your project?
Work through these questions in order, and the answer is usually clear.
- Ask whether the thing you map is continuous, like terrain or temperature, or discrete, like a road or a parcel.
- Decide whether each feature needs its own attributes, since vector keeps a record per feature.
- Check that your pixel size is small enough for the smallest object you need to see.
- Think about storage and processing limits before you commit to very fine cells.
You can also convert. The QGIS raster chapter describes a company turning road, rail and cadastral vectors into rasters so staff can view them in a web browser. The catch is that raster layers do not usually carry an attribute record for each cell, according to the QGIS data formats page.
File formats matter as well. The GeoPackage format was defined by the Open Geospatial Consortium and published in 2014, and it can hold both vector and raster data, according to the QGIS 3.44 documentation. As of that documentation, GeoPackage is the default vector format in QGIS, and GeoTiff is described as a good alternative for rasters.
An ESRI Shapefile dataset, by contrast, is spread across several files, and the same page lists the .shp, .dbf and .shx files as required. Keep them together whenever you move or share the data.
Frequently asked questions
Can I use raster and vector data in the same map?
Show answer
Yes, and most maps do. A common pattern is an orthoimage underneath road or boundary layers, which lets viewers confirm that the vectors line up with real objects on the ground.
Does zooming in make a raster sharper?
Show answer
No. The cell size is fixed when the data is created, so enlarging the view only makes each square look bigger. Detail can only be added by collecting finer data, not by resampling to a smaller pixel.
Is vector data always more precise than raster?
Show answer
Not automatically. A raster is limited by its cell dimensions, and forcing data onto a regular grid loses some geometric precision. A vector shape is only as good as the spacing of its captured vertices.
Why are some raster files so large?
Show answer
Every cell stores a value, so covering a wide area with tiny pixels multiplies the number of values. Drone and aerial imagery with very small ground sample distances is especially heavy to store and process.