Confused by DEM vs DSM vs DTM? A DSM shows the surface with buildings and trees, a DTM shows bare ground, and DEM is the umbrella term for both. Pick by whether objects on the ground matter to your task.
This guide is part of our wider look at geospatial terrain visualization, where elevation grids become maps and 3D views.
| Item | Value |
|---|---|
| Typical free DSM and DTM resolution | 30m or lower |
| Age of the imagery behind free models | Often acquired as early as the 2000s or 2010s |
| Archival 5m DSM price | From 7.00 EUR/km² |
| 0.5m DSM price | 55.00 EUR/km² |
| 0.5m DTM price | Twice the 0.5m DSM price |
| Price survey refresh | Typically every six months |
These figures come from the ESA Knowledge Hub page on Digital Elevation Models. Prices and data availability change, so check the source before you rely on them.
What each elevation model represents
A Digital Elevation Model (DEM) is a 3D representation of the Earth’s surface in digital form. Elevation is stored in a regular pixel grid of values, known as a raster, according to the ESA Knowledge Hub. The same source describes a “production line” that yields three subtypes:
- Digital Surface Model (DSM): the surface including everything on it, such as buildings, infrastructure and vegetation.
- Digital Terrain Model (DTM): the terrain with no above-ground features.
- Normalized Digital Surface Model (nDSM): the height of objects above the ground, made by subtracting the DTM from the DSM.
The naming trips people up because “DEM” works as both the family name and a loose label for bare-earth data. When a download is labelled only DEM, read its documentation to learn whether roofs and treetops were left in or removed.
All of these grids are a starting point rather than an end product. Slope and aspect, meaning the direction a slope faces, can be derived from them, as the ESA overview notes.
How these models are made
Three families of sensors feed most elevation products, and each has its own strengths. The ESA Knowledge Hub lists them as follows:
- Optical stereo imagery: satellites or aircraft capture the same ground from different angles to build a 3D model of the surface.
- Synthetic Aperture Radar (SAR): radar signals bounce off the surface and return a height signal.
- LiDAR: laser pulses produce highly accurate elevation data.
Photogrammetry follows a similar logic for imagery. The ArcGIS Pro documentation explains that overlapping images go through image matching, which cross-correlates them to produce 3D point clouds defined by latitude, longitude and elevation. Those point clouds are the raw material for both surface and terrain grids.
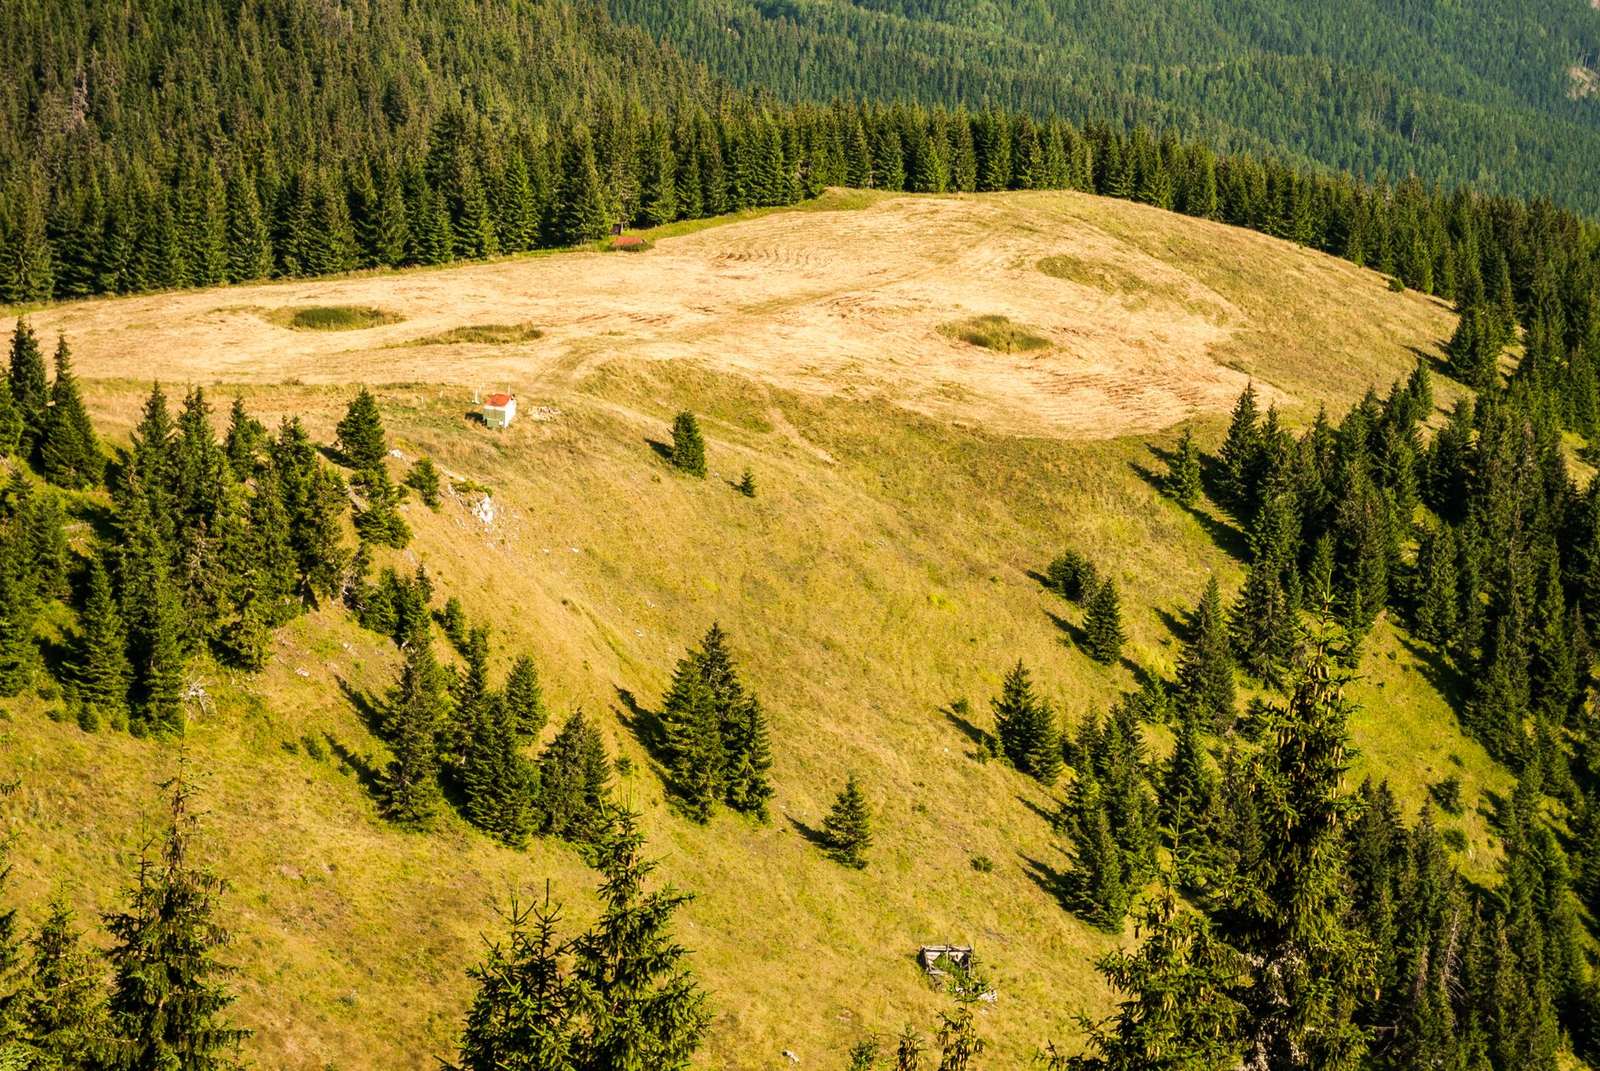
Sensor choice shapes the result. According to ESA, SAR is unaffected by cloud cover or the day-night cycle, although challenges remain in highly undulating and heavily vegetated terrain. Check the source if your area is steep or forested.
Which model fits your task?
Start with one question: do you need the ground, or the things standing on it? A DTM answers the first, a DSM the second, and the nDSM bridges the two.
- Water and hazard work: ESA says reliable DEMs support water flow modelling and watershed delineation, which helps assess exposure to landslides and floods.
- Orthorectifying imagery: Esri’s guidance says you need a calibrated sensor model along with a digital terrain model (DTM) to correct aerial images.
- Building heights: height from a normalised DSM can be added to building footprints to create simple 3D city models at scale.
- Slope and aspect maps: derive them from the elevation grid you already hold.
These uses are described by the ESA Knowledge Hub and the ArcGIS Pro documentation. Accuracy matters too: Esri notes that an orthoimage’s accuracy depends partly on the accuracy of the elevation model.
When no suitable DEM exists, Esri says the DSMs and DTMs must be derived from stereo imagery. That is a heavier workflow than downloading a ready-made grid.
Cost and resolution trade-offs
Resolution and age drive the price. ESA reports that DSMs and DTMs at 30m resolution (or lower) are available for free, yet the underlying imagery was often acquired as early as the 2000s or 2010s. Buildings, roads and vegetation may have changed since then.
Paid products get finer. The ESA Knowledge Hub gives these indicative prices:
- Archival 5m DSMs from 7.00 EUR/km².
- 0.5m DSMs at around 55.00 EUR/km².
- 0.5m DTMs at twice the DSM price.
The price is indicative only. ESA states that its market surveys are typically repeated every six months, and that a listed product is just one possible implementation.
Where to get and open the data
For high-resolution terrain, OpenTopography describes itself as a distributor of free high-resolution, Earth science-oriented topographic data, related tools and resources, per its FAQ page. Our guide to free GIS data covers other places to look.
Access rules vary by dataset. As of the January 2021 note in the same FAQ, USGS 3DEP data on the portal were only available to US academics with a valid .edu email account, so read the current terms before planning around it.
To view a DEM, the FAQ says you can display it as a hillshade in Google Earth. For more specialized work a GIS such as ArcGIS, GlobalMapper or QGIS is needed, while point cloud tools such as LASTools, CloudCompare or PDAL let you work with the raw points.
Once you start combining layers, make sure each uses the same system. Our explainer on coordinate reference systems shows how mismatches shift your terrain against other maps.
Frequently asked questions
Is a DEM the same thing as a DSM or a DTM?
Show answer
Not quite. A DEM is the broad category, and DSM and DTM are the two main flavours inside it. Which one you hold depends on whether objects above the ground were kept in the grid.
What is an nDSM good for?
Show answer
It tells you how tall things are above the ground. You get it by taking away the terrain model from the surface model, as the ESA Knowledge Hub describes.
Why might a free elevation model not match what I see outside?
Show answer
Free grids at 30m or coarser were often built from imagery captured in the 2000s or 2010s, per ESA. New construction, felled forests or reshaped land will not appear.
Which sensor copes with cloudy regions?
Show answer
Radar. SAR works regardless of cloud or daylight, but dense vegetation and rugged relief can still cause problems, so test a sample area first.