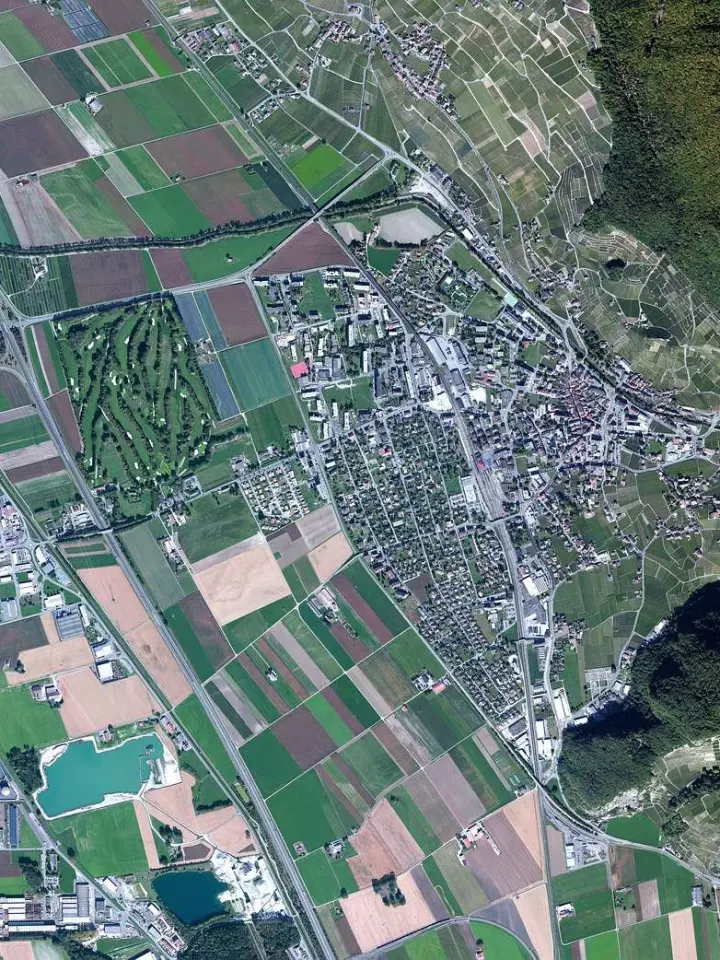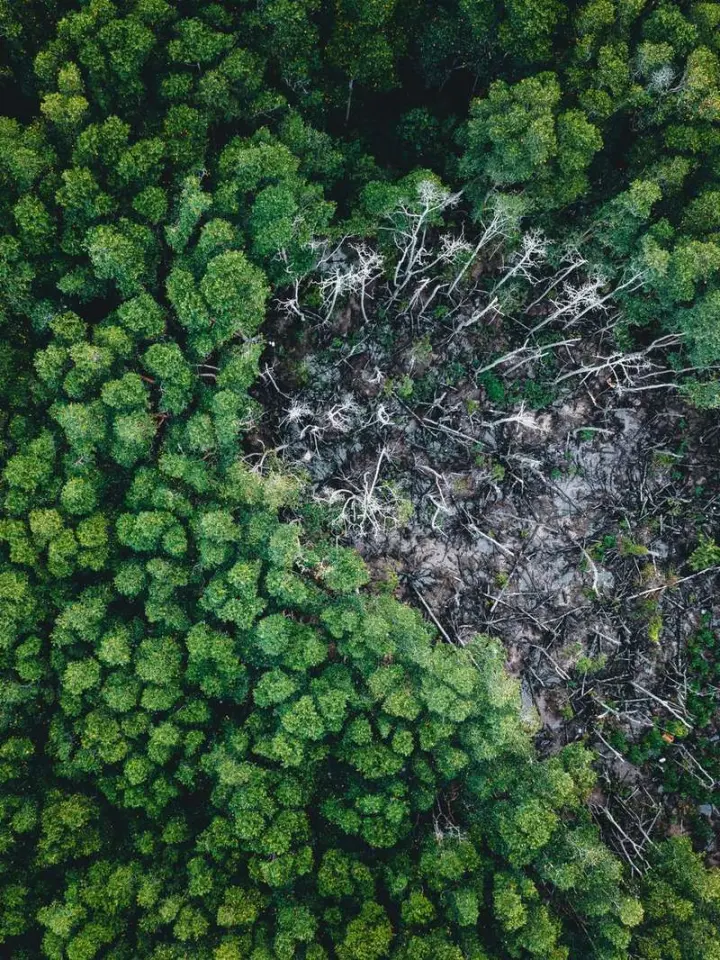
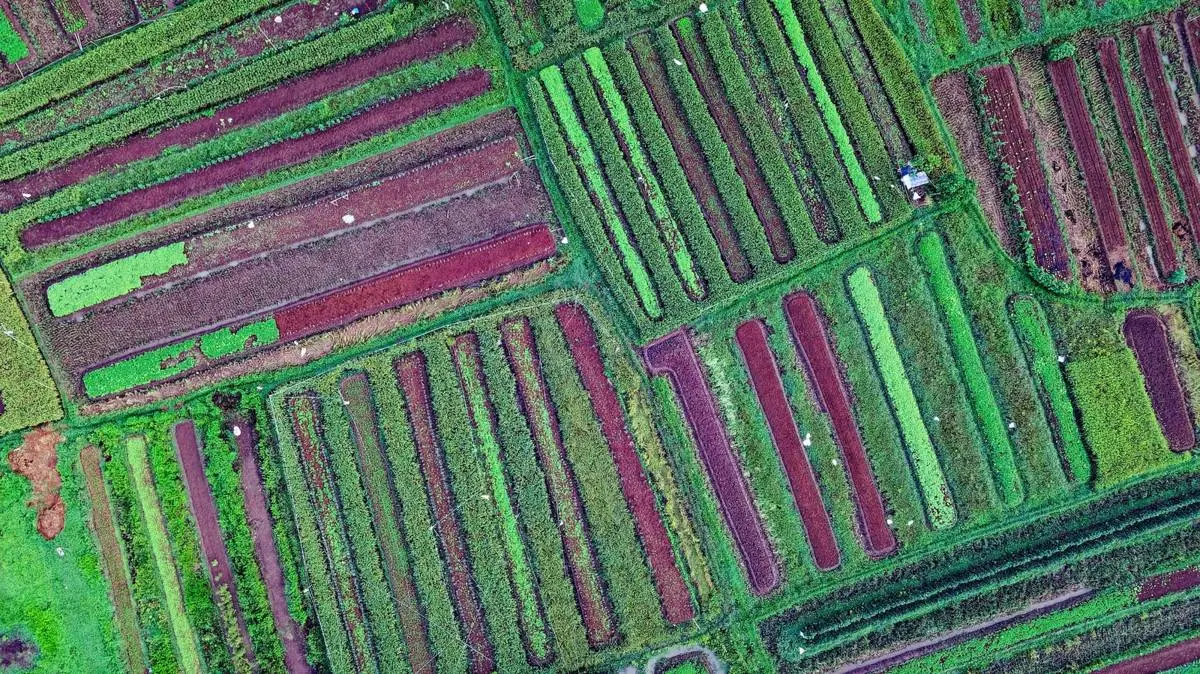
Seen a bright-red forest in a satellite picture and wondered what you’re looking at? Satellite imagery band combinations assign grayscale bands to red, green and blue, so natural color matches your eyes and false color reveals vegetation, water and burns.
This guide is one part of our wider look at satellite imagery, so start there if the basics are new to you.
| Item | Value |
|---|---|
| Natural-color composite (Landsat 8) | Bands 4,3,2 |
| Color-infrared composite (Landsat 8) | Bands 5,4,3 |
| False-color composite (Landsat 8) | Bands 7,5,4 |
| Spectral bands on Landsats 8 and 9 | 11 spectral bands |
| Landsat 8 scene footprint | About 185 by 185 kilometers |
| Landsat 8 daily collection | About 400 scenes per day |
These figures come from the USGS EROS Earthshots page and NASA’s Earth Observatory tutorial. Agencies revise their pages and plans, so check the source before you rely on them.
From grayscale bands to a color picture
Every color on your screen comes from mixing different amounts of red, green and blue light, often called RGB. USGS EROS explains that satellite pictures follow the same logic, with one catch: Landsat sensors do not record color directly.
Instead, the instruments capture grayscale images, each showing how bright the surface is in a single wavelength range. Scientists then assign every band to red, green or blue, and the three-way mix becomes the picture you see.
NASA’s Earth Observatory adds that a photograph forms when light is focused on a light-sensitive surface such as film or a CCD. A satellite image is instead built by combining measurements of certain wavelengths, some visible and some invisible to human eyes, as explained in its guide to false-color images.
Human vision covers a narrow slice of that range. ESA’s newcomers’ guide puts the visible spectrum at 0.39 to 0.70 μm, with part of the infrared reaching from 0.70 to 14 μm, which explains why a composite can show more than a camera would.
Why the number of bands keeps growing
Each band is a different slice of the electromagnetic spectrum, so more bands mean more ways to build a composite. Landsat shows the trend clearly, as the USGS list below makes plain.
| Landsat instrument | Spectral bands |
|---|---|
| Landsats 1-5, Multispectral Scanner (1972 – 2013) | 4 spectral bands |
| Landsat 4-5, Thematic Mapper (1982-2012) | 7 spectral bands |
| Landsat 7, Enhanced Thematic Mapper Plus (1999-2025) | 8 spectral bands |
| Landsats 8 and 9, Operational Land Imager and Thermal Infrared Sensor | 11 spectral bands |
| Landsat 10, sensor to be decided (about 2031) | 26 spectral bands planned |
The list comes from the USGS EROS Earthshots page; the Landsat 10 entry is a plan as listed there, so check the source for updates.
USGS says images have become more detailed and informative as bands were added. Different combinations now help scientists and the public explore everything from plant health and water quality to urban growth and natural disasters.
Three Landsat 8 composites of one place
USGS shows the Mt. Vernon, Washington area from Landsat 8 data acquired in 2013 and renders it three ways. It labels bands 4,3,2 as natural color, bands 5,4,3 as color infrared, and bands 7,5,4 as false color, on the USGS EROS Earthshots page.
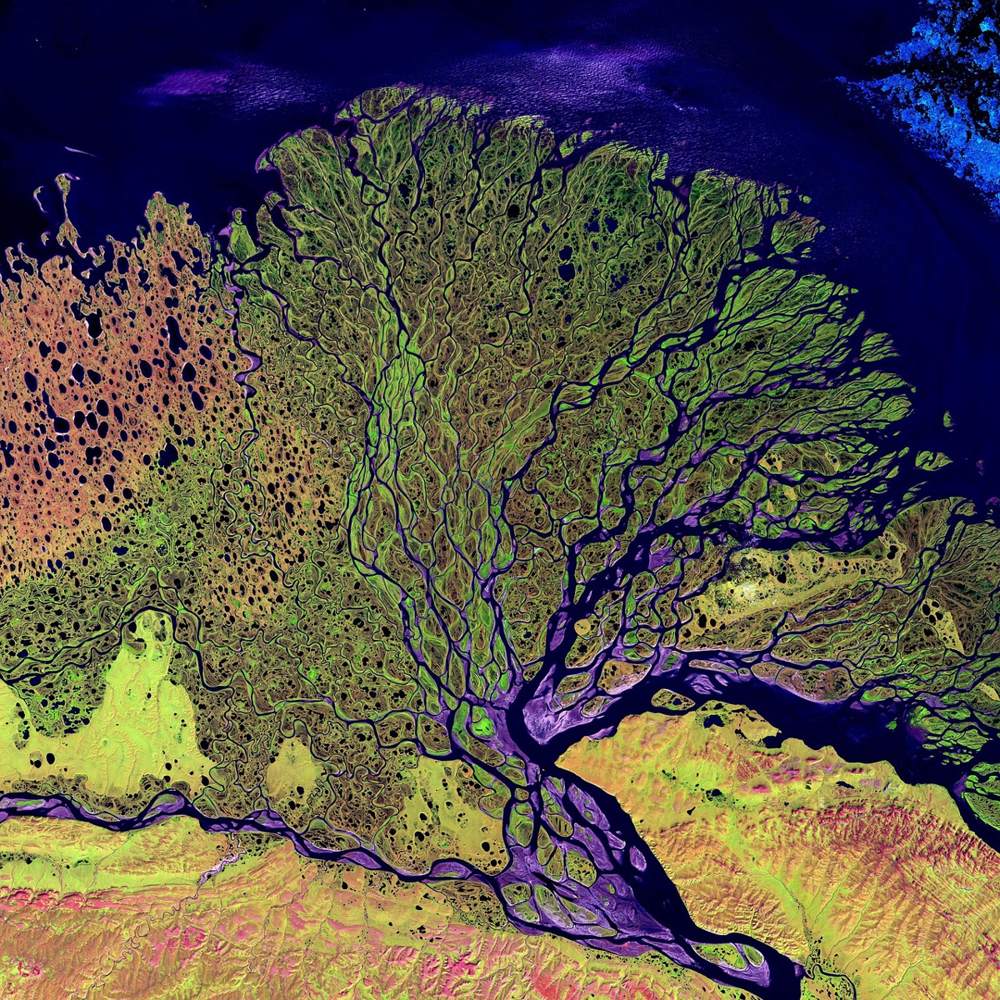
Compare the three versions and notice that the ground never changed, only the assignment of bands to display colors. USGS notes that, depending on the bands chosen, a composite can look like what our eyes see or can highlight vegetation, water or soil.
A good habit follows from this: read the caption for the band list before you interpret any color. The same green patch can mean healthy crops in one recipe and something else entirely in another.
Which false-color recipe shows what
The most familiar recipe, described in ESA’s guide, shows a near-infrared band in the red channel, the red band in the green channel and the green band in the blue channel. Healthy vegetation creates chlorophyll that reflects near-infrared energy, so it appears in darker red.
NASA’s Earth Observatory shows the same effect from space. In a view from the Messenger spacecraft, plant-covered land from the Amazon rainforest to North American forests is red because the image incorporates both visible and infrared light, as described in its false-color guide.
The same ESA guide lists further recipes, each tuned to a different job:
- Floods and burn scars: shortwave infrared in red, near infrared in green and green in blue.
- Snow, ice and clouds: blue in red, with two different shortwave infrared bands in green and blue.
- Water depth, vegetation, soil moisture and fires: blue in blue, near infrared in green and mid infrared in red.
Treat each recipe as a legend. Once you know which band feeds which channel, an unfamiliar color stops being a mystery and becomes a clue.
How do you read a composite without being fooled?
NASA’s Earth Observatory compares satellite images to maps: full of information, provided you have a key. Its interpretation guide gives five tips:
- Look for a scale.
- Look for patterns, shapes and textures.
- Define the colors, including shadows.
- Find north.
- Consider your prior knowledge.
The tips come from the writers and visualizers who use them to interpret images daily. Color is only the third on the list, so a composite rewards more than a glance at its hues.
Optical composites also depend on light and clear skies. ESA’s guide says passive imagery is usually tied to the day-night cycle and can be degraded or blocked by cloud cover, and SAR vs optical imagery shows what radar can add when an optical view fails.
Once you can read vegetation in color, the guide to NDVI shows how a similar signal can be turned into a single index you can map and track.
Building a true-color image yourself
NASA’s Earth Observatory walks through making a true-color picture from Landsat 8 data. Since its launch in February 2013, the satellite has collected about 400 scenes per day, so the tutorial advises processing each scene individually to bring out detail in a specific region, according to the NASA tutorial.
A download holds 11 separate image files, plus a quality assurance file and a text file of metadata, as the same tutorial explains. The workflow then runs in four steps:
- Download a scene from the Landsat archive, or use a sample dataset.
- Unpack the archive and locate the band files for the natural-color bands.
- Assign those bands to the red, green and blue channels in an image editor.
- Adjust curves and levels until the contrast brings out the landscape.
The tutorial says no specialized software is needed. Photoshop, or any editor that supports 16-bit TIFF images along with curve and level adjustments, will do, per the NASA tutorial.
Frequently asked questions
What is the difference between true color and false color?
Show answer
A true-color (natural-color) picture feeds visible red, green and blue bands into matching display channels, much as a consumer camera does, according to ESA. A false-color picture swaps in other bands, such as near infrared, so features like healthy vegetation stand out.
Do band numbers mean the same thing on every satellite?
Show answer
No. Sensors differ in how many bands they carry, from 4 spectral bands on the earliest Landsat scanner to 11 spectral bands on Landsats 8 and 9, according to USGS. The 4,3,2 label in the USGS example belongs to Landsat 8, so look up the band list of any other sensor before copying a recipe.
Is a false-color image a doctored photo?
Show answer
No, because a satellite picture was never a snapshot to begin with. It is assembled from measurements of light intensity, and false color simply picks a different mapping, as NASA’s Earth Observatory explains.
What does pan-sharpening do to a color composite?
Show answer
It merges a multi-spectral image with a panchromatic one to give a high-resolution colored result, according to ESA. The sharper look does not change which bands feed which color, so you still need the caption’s band list.