Staring at a satellite image and unsure what you’re seeing? Here is how to interpret satellite images: check the scale, read patterns and textures, decode the colors, find north, and use what you already know.
For the bigger picture on where these scenes come from, start with the hub on satellite imagery.
| Item | Value |
|---|---|
| Landsats 1-5 Multispectral Scanner | 4 spectral bands |
| Landsat 4-5 Thematic Mapper | 7 spectral bands |
| Landsat 7 Enhanced Thematic Mapper Plus | 8 spectral bands |
| Landsats 8 and 9 Operational Land Imager and Thermal Infrared Sensor | 11 spectral bands |
| Planned Landsat 10 (sensor to be decided, about 2031) | 26 spectral bands planned |
These band counts come from the USGS EROS Earthshots page, and the interpretation tips below follow NASA Earth Observatory’s guide. Missions and plans change, so check the source before you rely on the figures.
Why a satellite image is not a snapshot
A photograph is one exposure, but a satellite image is built from measurements. NASA Earth Observatory explains that it is created by combining measurements of the intensity of certain wavelengths of light, both visible and invisible to human eyes, as described in its false-color guide.
That is why NASA compares these images to maps: they are full of useful and interesting information, provided you have a key. The tips come from the Earth Observatory’s writers and visualizers, who use them to interpret images daily, according to NASA’s interpretation guide.
Used well, the key lets an image show how much a city has changed, how well crops are growing, where a fire is burning, or when a storm is coming, per the same NASA page. Work through these steps in order:
- Look for a scale.
- Look for patterns, shapes and textures.
- Define the colors, shadows included.
- Find north.
- Consider your prior knowledge.
Start with the scale
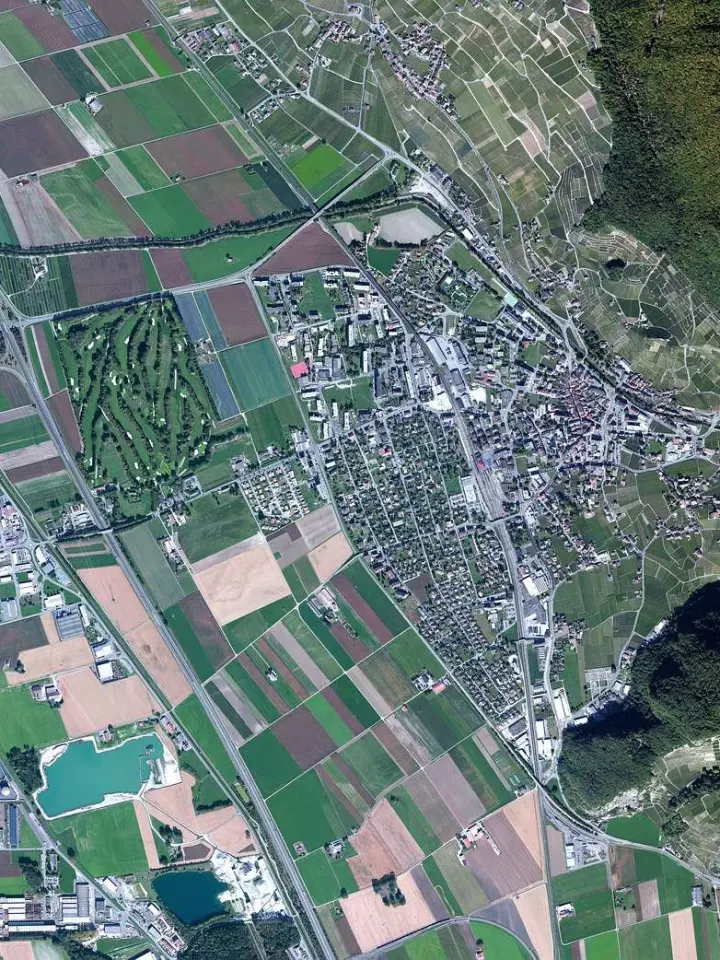
Most people first hunt for somewhere familiar, such as a home, a park or a lake. Whether you can find it depends on the scale of the scene. NASA notes that some satellites zoom in on small areas to collect fine details down to the scale of individual houses or cars, and in the process they usually sacrifice the big picture, per its interpretation guide.
NASA’s own example pairs images from the commercial WorldView-2 satellite, which show street by street details of the September 2013 flood in Boulder, Colorado, with the scientific Landsat 8 satellite, as laid out in the same guide. The same event looks very different depending on the sensor and the zoom.
Before you read anything into a scene, ask yourself:
- What is the smallest object you can make out?
- How much surrounding land is in view?
- Is there a feature you recognize that gives you a size reference?
Read patterns, shapes and textures
Once you know the scale, slow down before you name anything. Patterns, shapes and textures are the second tip on NASA’s list, and they work best as clues rather than answers. Outlines, repeated forms and the smooth or rough grain of a surface narrow down what you might be looking at.
A useful habit is to describe what you see in plain words first, then label it. For example, “a long curving dark band” is an observation, while “a river” is a guess you still need to test against color, scale and a map.
- Note the outline: is it ragged, rounded or ruler-straight?
- Note repetition: do similar shapes recur across the scene?
- Note the grain: does the surface look smooth, speckled or streaked?
Define the colors, including false color
Every color on your screen is a mix. The USGS explains that all the colors you see in a satellite image are created by mixing different amounts of red, green, and blue light (often called RGB), as the USGS EROS page describes.
Landsat instruments do not collect color pictures directly. They capture grayscale images in many portions of the electromagnetic spectrum, and scientists assign each band to red, green or blue; when three bands are combined this way, the result is a color image, according to the USGS.
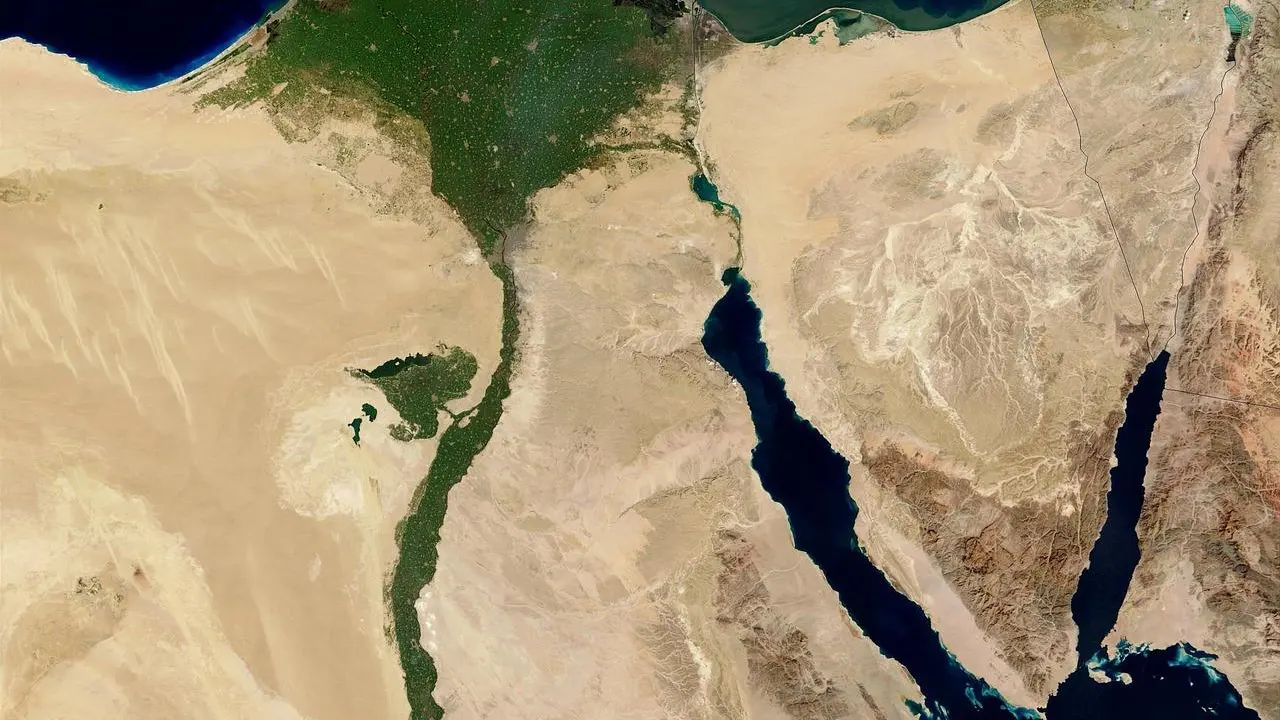
The choice of bands decides what you see. It can create a natural-color image, like what our eyes see, or a false-color image that highlights features such as vegetation, water, or soil, per the same page. The USGS shows this with Landsat 8 data acquired in 2013 near Mt. Vernon, Washington:
- Bands 4,3,2 give a natural color view.
- Bands 5,4,3 give a color infrared view.
- Bands 7,5,4 give a false color view.
False color can look strange at first, but it is not a trick. In a view from the Messenger spacecraft that combines visible and infrared light, plant-covered land from the Amazon rainforest to North American forests appears red, as NASA’s false-color guide shows.
Always read the caption to learn which bands were used. Shadows count as color too, so check whether a dark patch is a shadow or a dark surface before you decide what it is.
Find north and bring what you already know
Direction is easy to assume and easy to get wrong. Find north using the caption, a map overlay or a landmark you can verify, and only then judge which way a river flows or a coastline faces.
The last tip is to consider your prior knowledge. If you know a region’s climate, farming calendar or road layout, use that background to test your first reading of the scene, and treat any mismatch as a reason to look again.
When you are comfortable reading one scene, comparing scenes taken at different times is the natural next skill, which our guide to satellite image change detection covers. To find scenes to practise on, see this overview of free satellite imagery.
Frequently asked questions
Is a satellite image the same as a photograph?
Show answer
No. A photo records focused light on a light-sensitive surface, while a satellite image is assembled from sensor measurements, some of them in wavelengths people cannot see. NASA Earth Observatory draws this distinction in its false-color guide.
Why do forests sometimes look red?
Show answer
Some views assign infrared light to a display color, so healthy plant cover can show up as red. The Messenger spacecraft view in NASA’s guide is one example.
How many bands do the newest Landsat satellites record?
Show answer
The USGS EROS page lists 11 spectral bands for Landsats 8 and 9, and it lists a planned 26 spectral bands for Landsat 10, with the sensor still to be decided. See the USGS Earthshots page for its own wording.
What can different band combinations reveal?
Show answer
According to the USGS, band combinations help scientists and the public explore everything from plant health and water quality to urban growth and natural disasters.